
July 15, 2026
Amazon UK Prime Day 2026 Full-Event Recap: Shoppers Traded Down and Reshaped Where Growth Landed
A PMG analysis of Amazon UK data over the course of Prime Day 2026 points to consumers spreading their spending across more everyday categories, migrating meaningfully toward lower price points, and pulling average order values down for bigger-ticket items, even as they dug a little deeper when purchasing less expensive ones. The net result is a Prime Day that looks more like a broad, value-conscious shopping trip than in previous years.
This recap focuses on the full-event sales trends observed across Amazon UK during Prime Day 2026, with all year-over-year comparisons made against the corresponding 2025 Prime Day event. Figures reflect the share of units sold, revenue share by price band, average order value (AOV) by category, and brand-level category revenue share among the top 1,000 UK brands by trailing 12-month revenue.
Grocery and Beauty Categories Take a Bigger Share of Prime Day Purchases in the UK
The clearest structural shift of the event was in the mix of what sold. Compared with 2025, everyday and consumable categories captured a larger share of total units sold, while the historically dominant home and tech aisles gave ground.
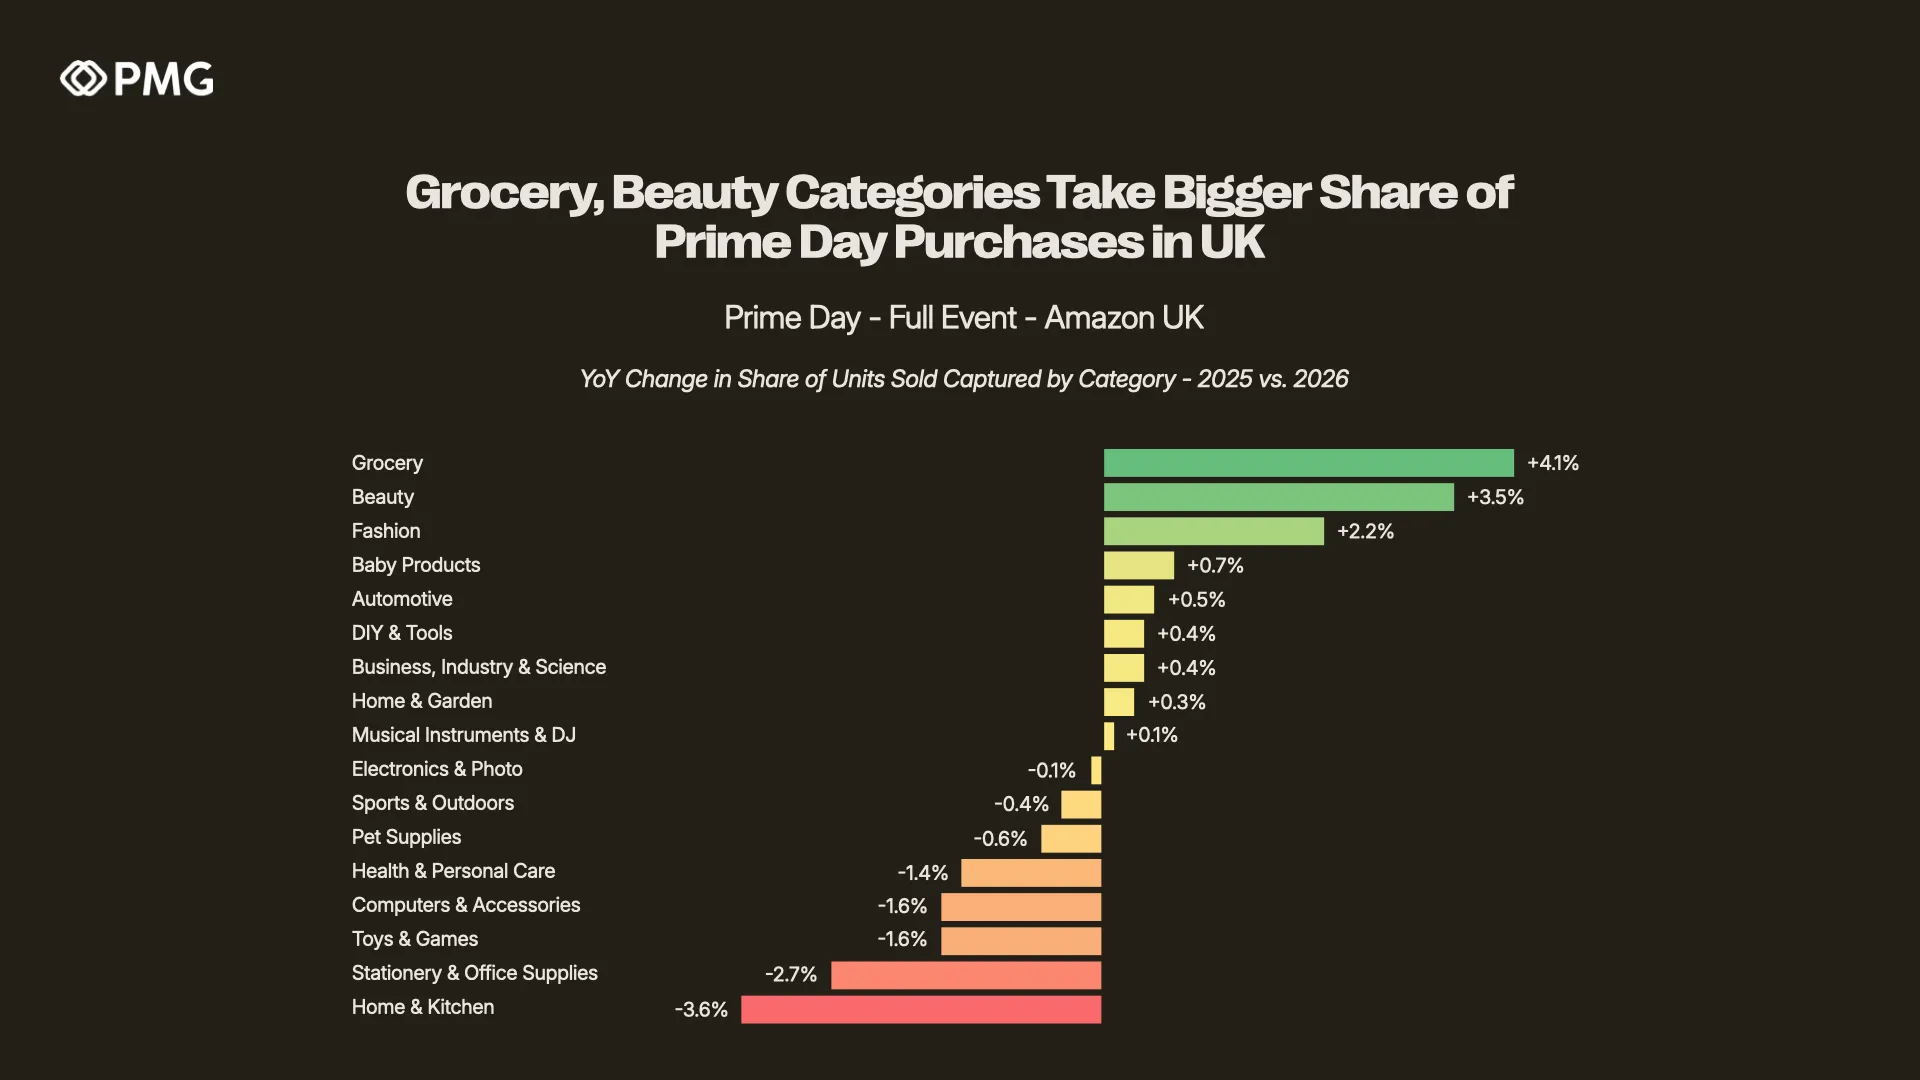
Grocery posted the single largest gain, adding +4.1 percentage points of unit-sold share year-over-year. Beauty followed closely at +3.5 points, and Fashion added +2.2 points. Other everyday categories edged up as well, including Baby Products (+0.7 pts), Automotive (+0.5 pts), and DIY & Tools (+0.4 pts). Together, these trends signal a broader, more essentials-driven basket than the tech-led Prime Days of years past
The offsetting declines came almost entirely from the traditional Prime Day stalwart categories. Home & Kitchen shed the most share at -3.6 points, followed by Stationery & Office Supplies (-2.7 pts), Toys & Games (-1.6 pts), Computers & Accessories (-1.6 pts), and Health & Personal Care (-1.4 pts).
The takeaway for brands is that Prime Day demand in the UK is diffusing outward from its tech-and-home core toward frequently purchased consumables. Perhaps driven in part by generalized inflation and broader economic anxiety, consumers are using Prime Day less to make bigger-ticket purchases they’ve been waiting on and more to get discounts on items already on their weekly shopping list.
More Revenue Shifted to Lower Price Points as Consumers Traded Down
Beneath the category mix sat a pronounced price trade-down. When the data is cut by price band, the revenue share moves decisively toward the lower end of the ladder.
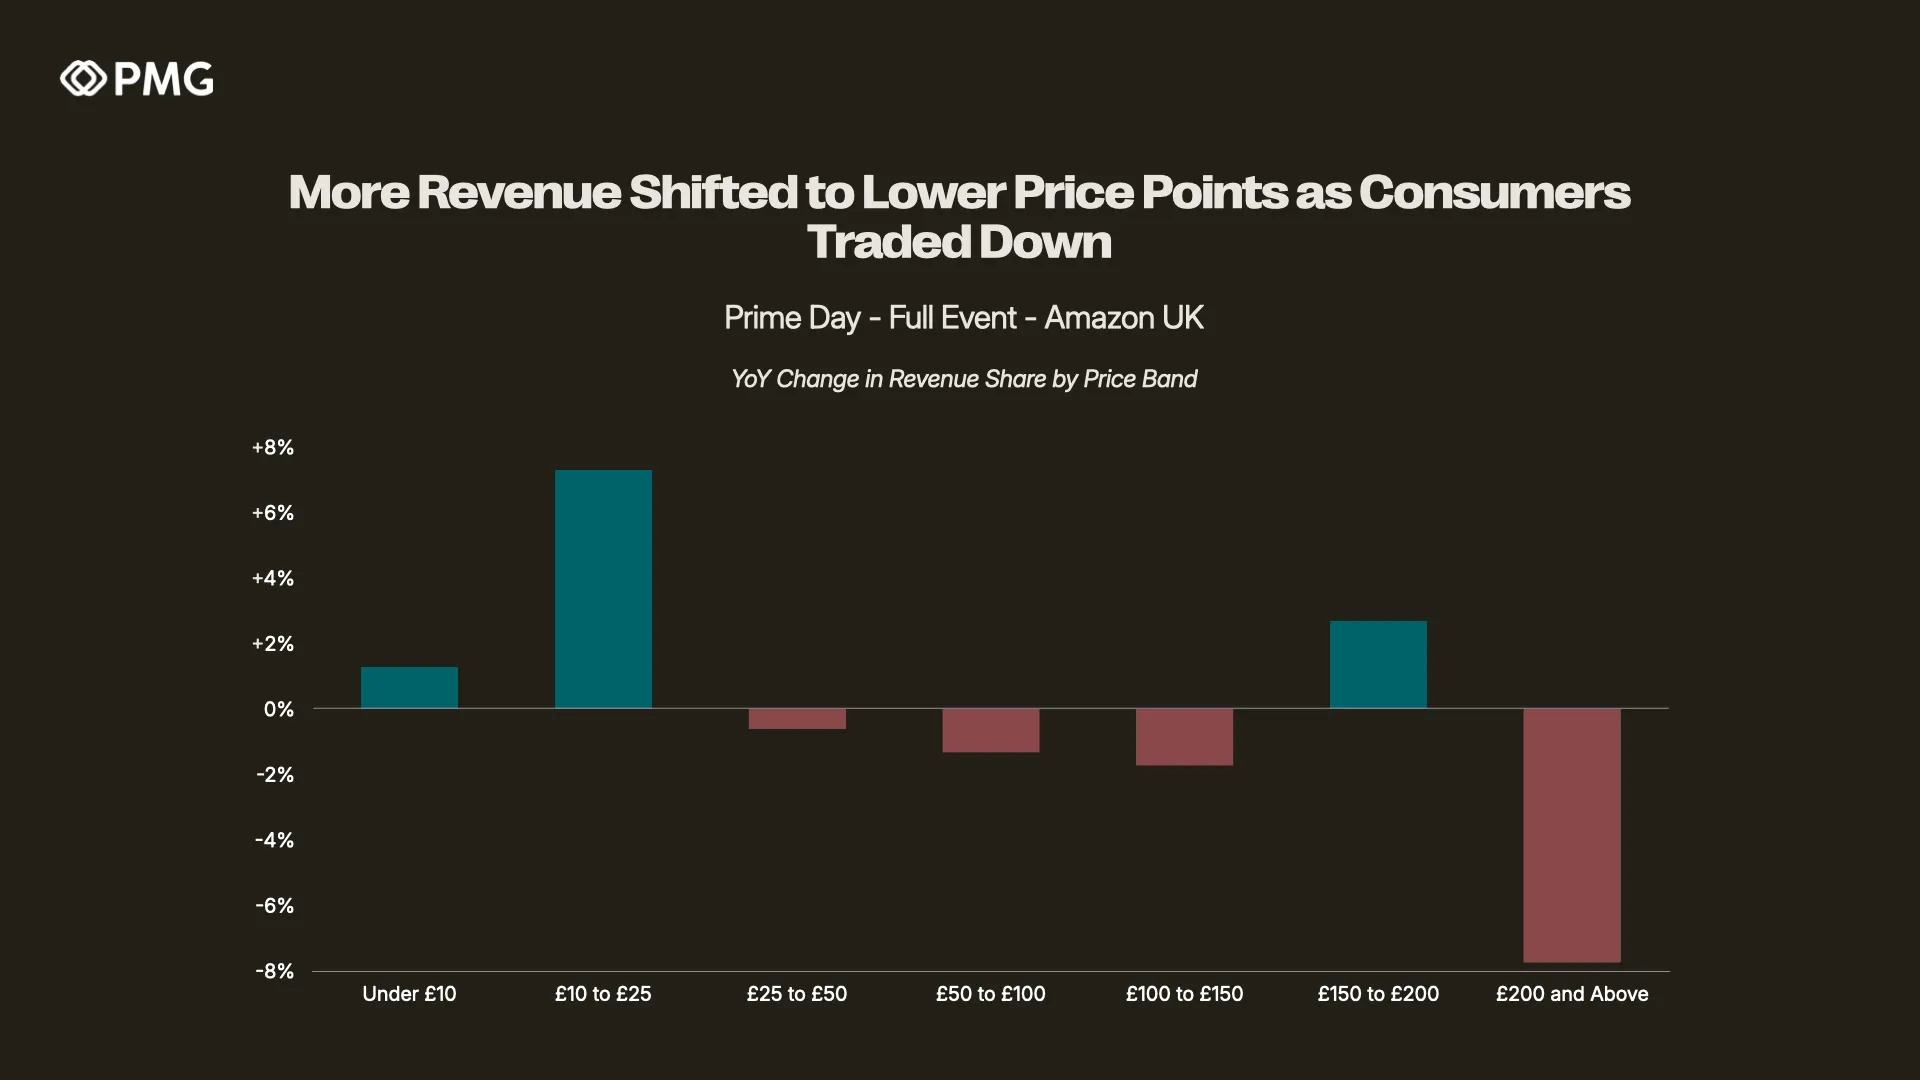
The £10 to £25 band was the engine of the shift, capturing +7.3 points more revenue share than in 2025, by far the largest single-band gain of the event.
The entry-level under-£10 band also grew by 1.3 points.
At the very top, the £200 and above band gave back the most, shedding -7.7 points of revenue share, with the £100 to £150 (-1.7 pts) and £50 to £100 (-1.3 pts) bands also softening.
The one exception to the top-end pullback was the £150-£200 band, which added 2.7 points, suggesting a resilient pocket of considered mid-premium purchasing.
Read together, the price-band and category data tell a consistent story of UK shoppers concentrating their Prime Day spending on affordable, high-frequency purchases and stepping back from the largest-ticket outlays. For brands, that reinforces the value of having a compelling entry-price or mid-tier offerings in the market during upcoming sale events in Q3 and Q4.
AOVs Dropped Across Key, Bigger-Ticket Categories
As one would expect, trading-down activity was most evident in categories with higher average price points. Average order values fell year-over-year across the UK's marquee big-ticket aisles.
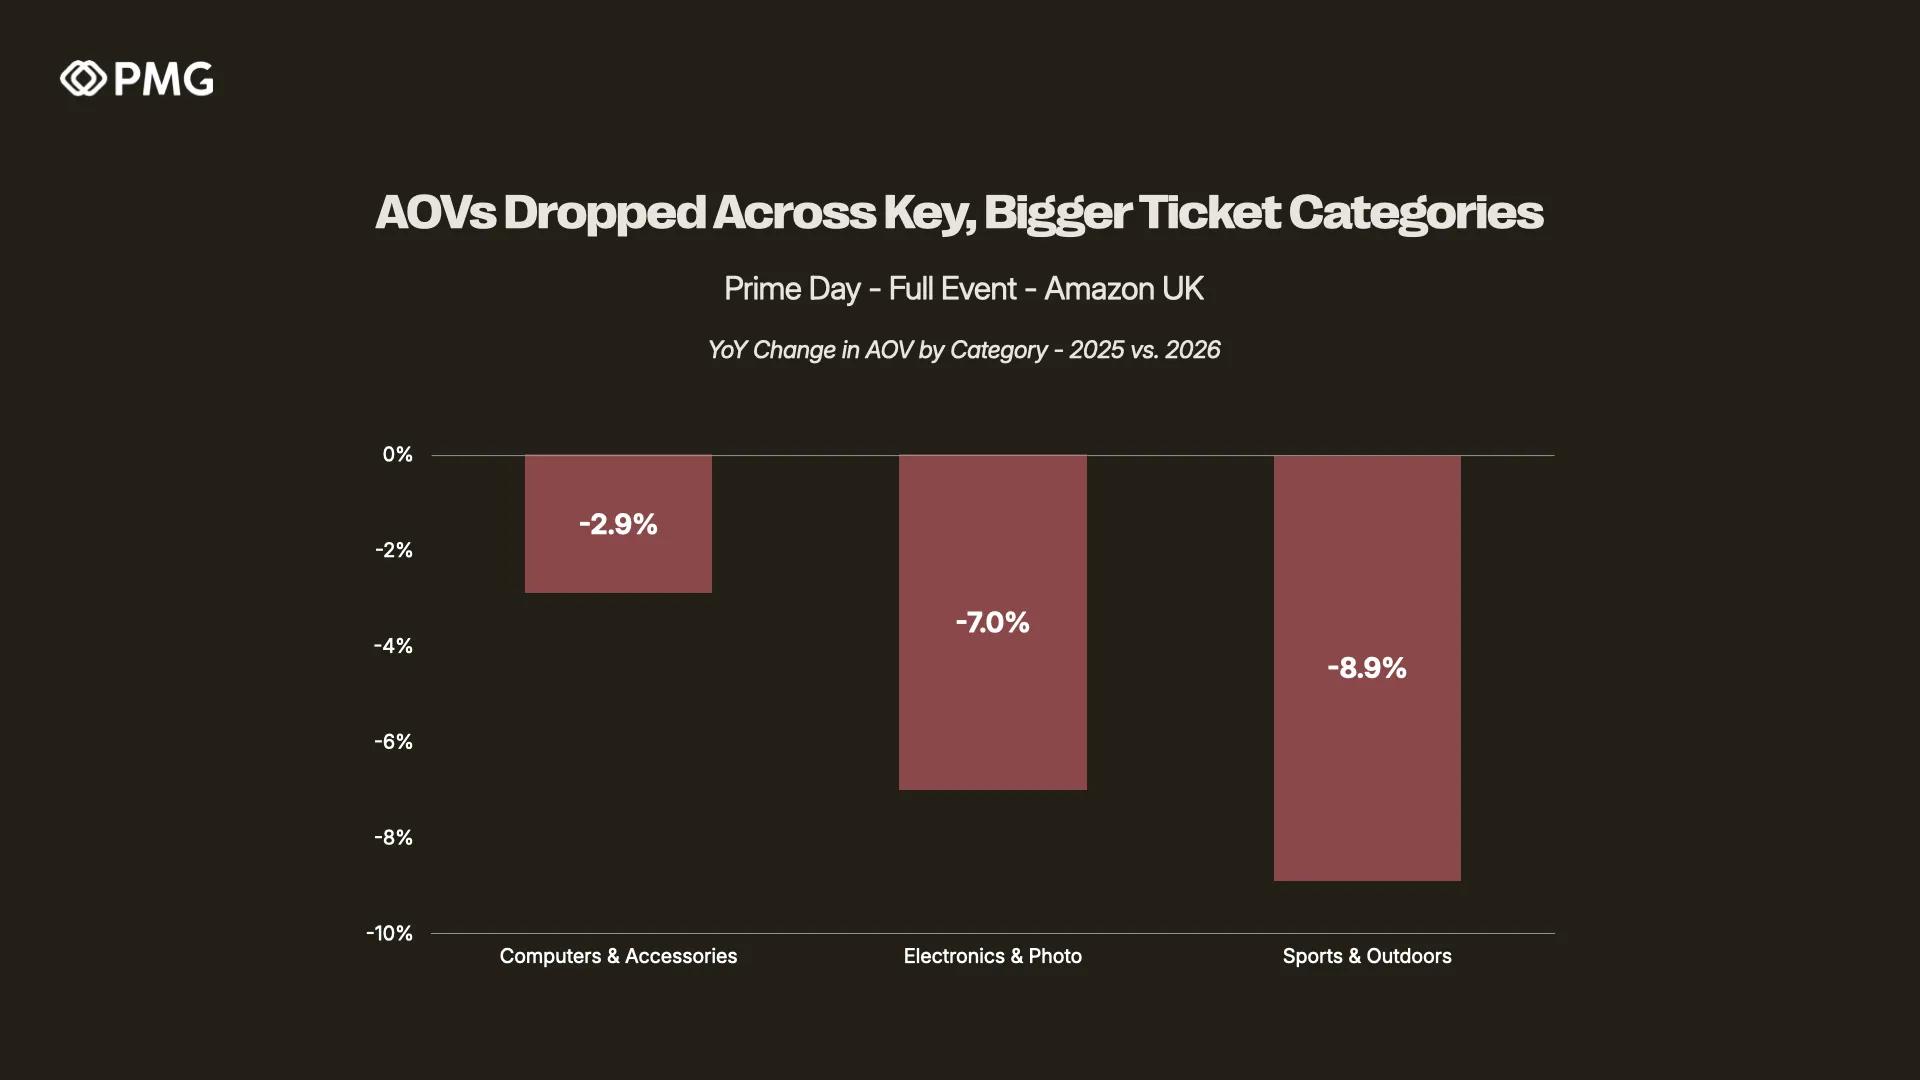
Sports & Outdoors saw the steepest decline, with AOV down -8.9%.
Electronics & Photo followed at -7.0%.
Computers & Accessories eased more modestly, down 2.9%.
The pattern follows the price-band migration seen across the site. With revenue share draining out of the £200-plus tier, categories with more items sitting at those higher price points saw their average basket size compress. For brands in these categories, this trend should be taken into account when planning the remainder of the year. Focusing on ways to optimize the visibility of price-competitive products, rather than those with the highest margins, is likely to resonate better with the UK market.
Consumers Dug Deeper for Purchases in Less Costly Categories
Crucially, the AOV story was not a uniform retreat. In several lower-priced, everyday categories, UK shoppers actually spent more per order than they did a year ago. This stands as a near mirror image of the bigger-ticket category compression.
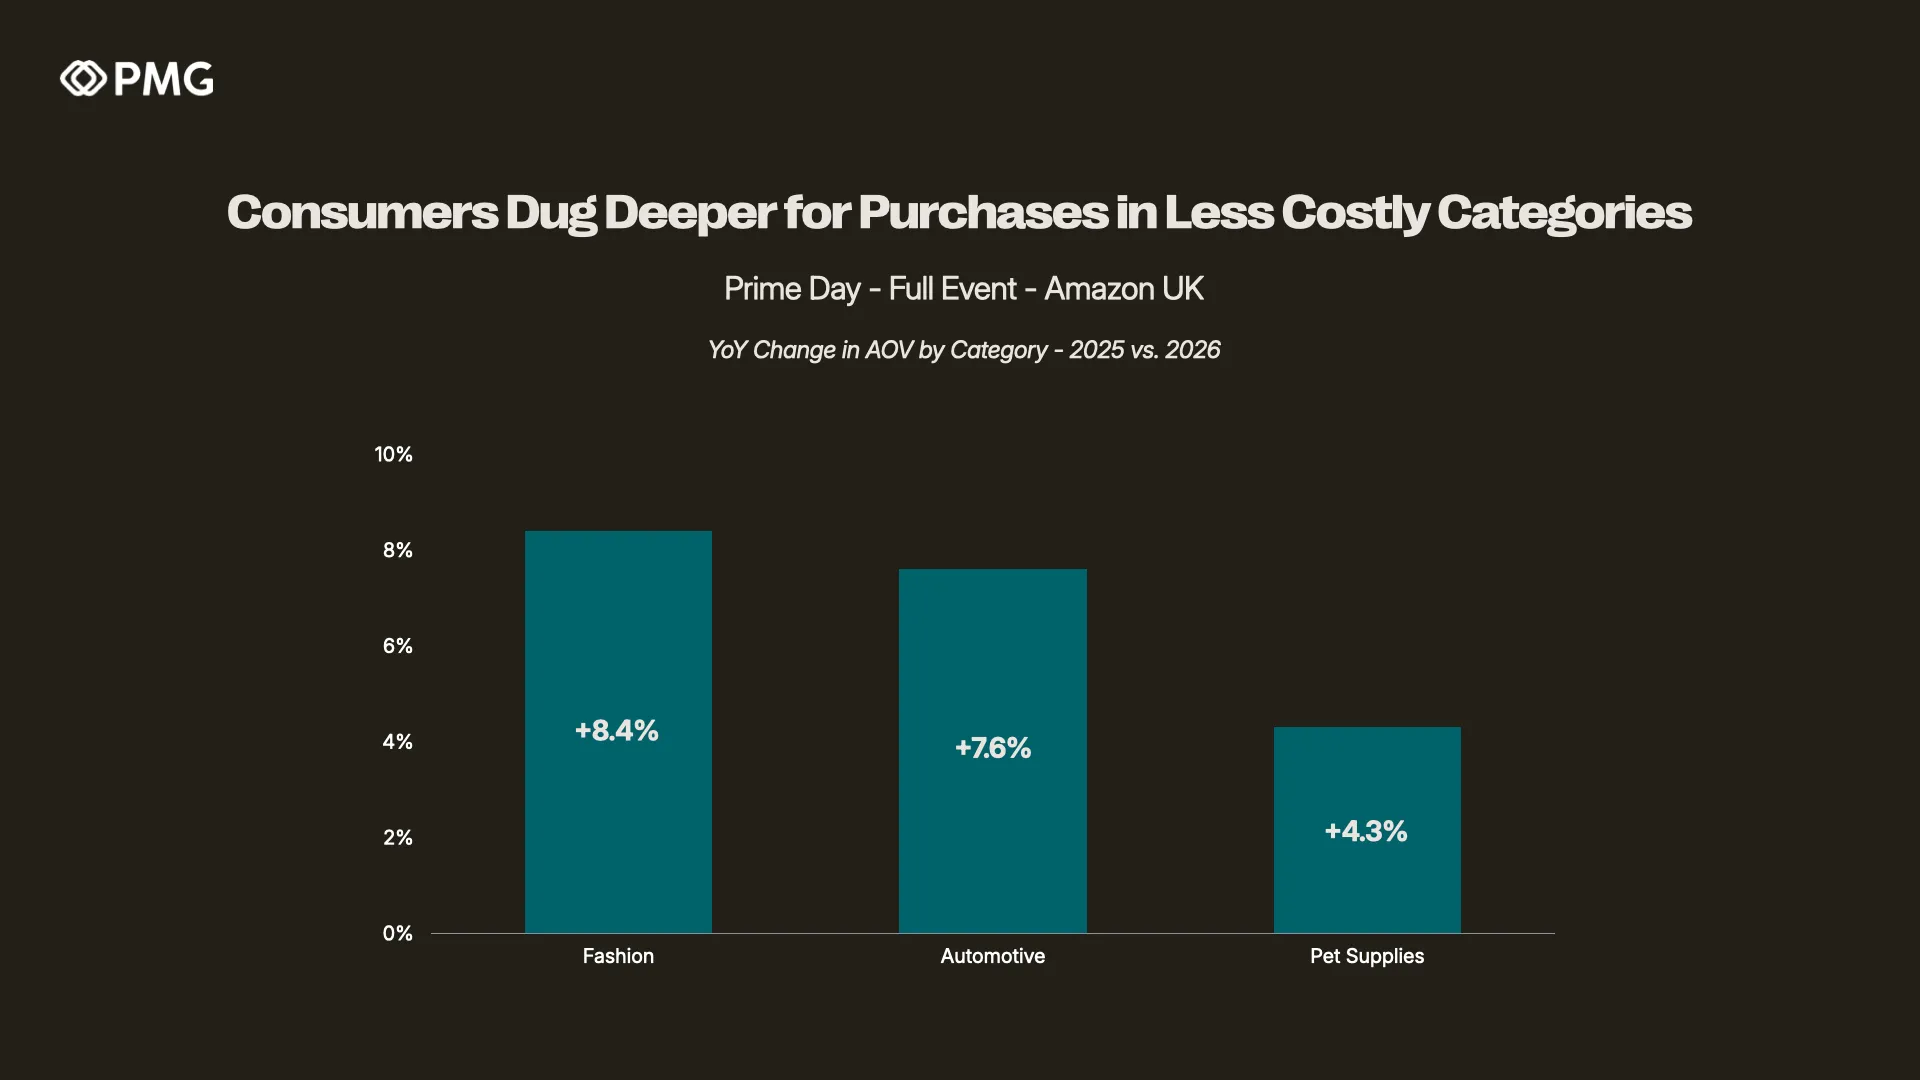
Fashion led the way, with AOV up +8.4% year-over-year.
Automotive rose +7.6%, and Pet Supplies climbed +4.3%.
This is arguably the most encouraging signal in the dataset, suggesting that trading-down activity was not simply belt-tightening across the board but rather a reallocation of spending. Consumers generally pulled back from the most expensive purchases while treating themselves in more affordable, frequently purchased categories.
For brands in these aisles, Prime Day 2026 presents an opportunity, even in a challenging macro environment, to grow order value through effective retail readiness and strategies like bundling, multi-packs, and cross-selling, rather than through discount depth alone.
Brand Names and Lesser-Known Labels Both Take Top Growing Slots, Showing the Fluidity of the Market
Finally, the brand-level view underscores that category growth in the UK was not confined to top brand names or upstarts alone. Among the top 1,000 UK brands by trailing-twelve-month revenue, the fastest risers in year-over-year category market share spanned established household names and challenger labels alike.
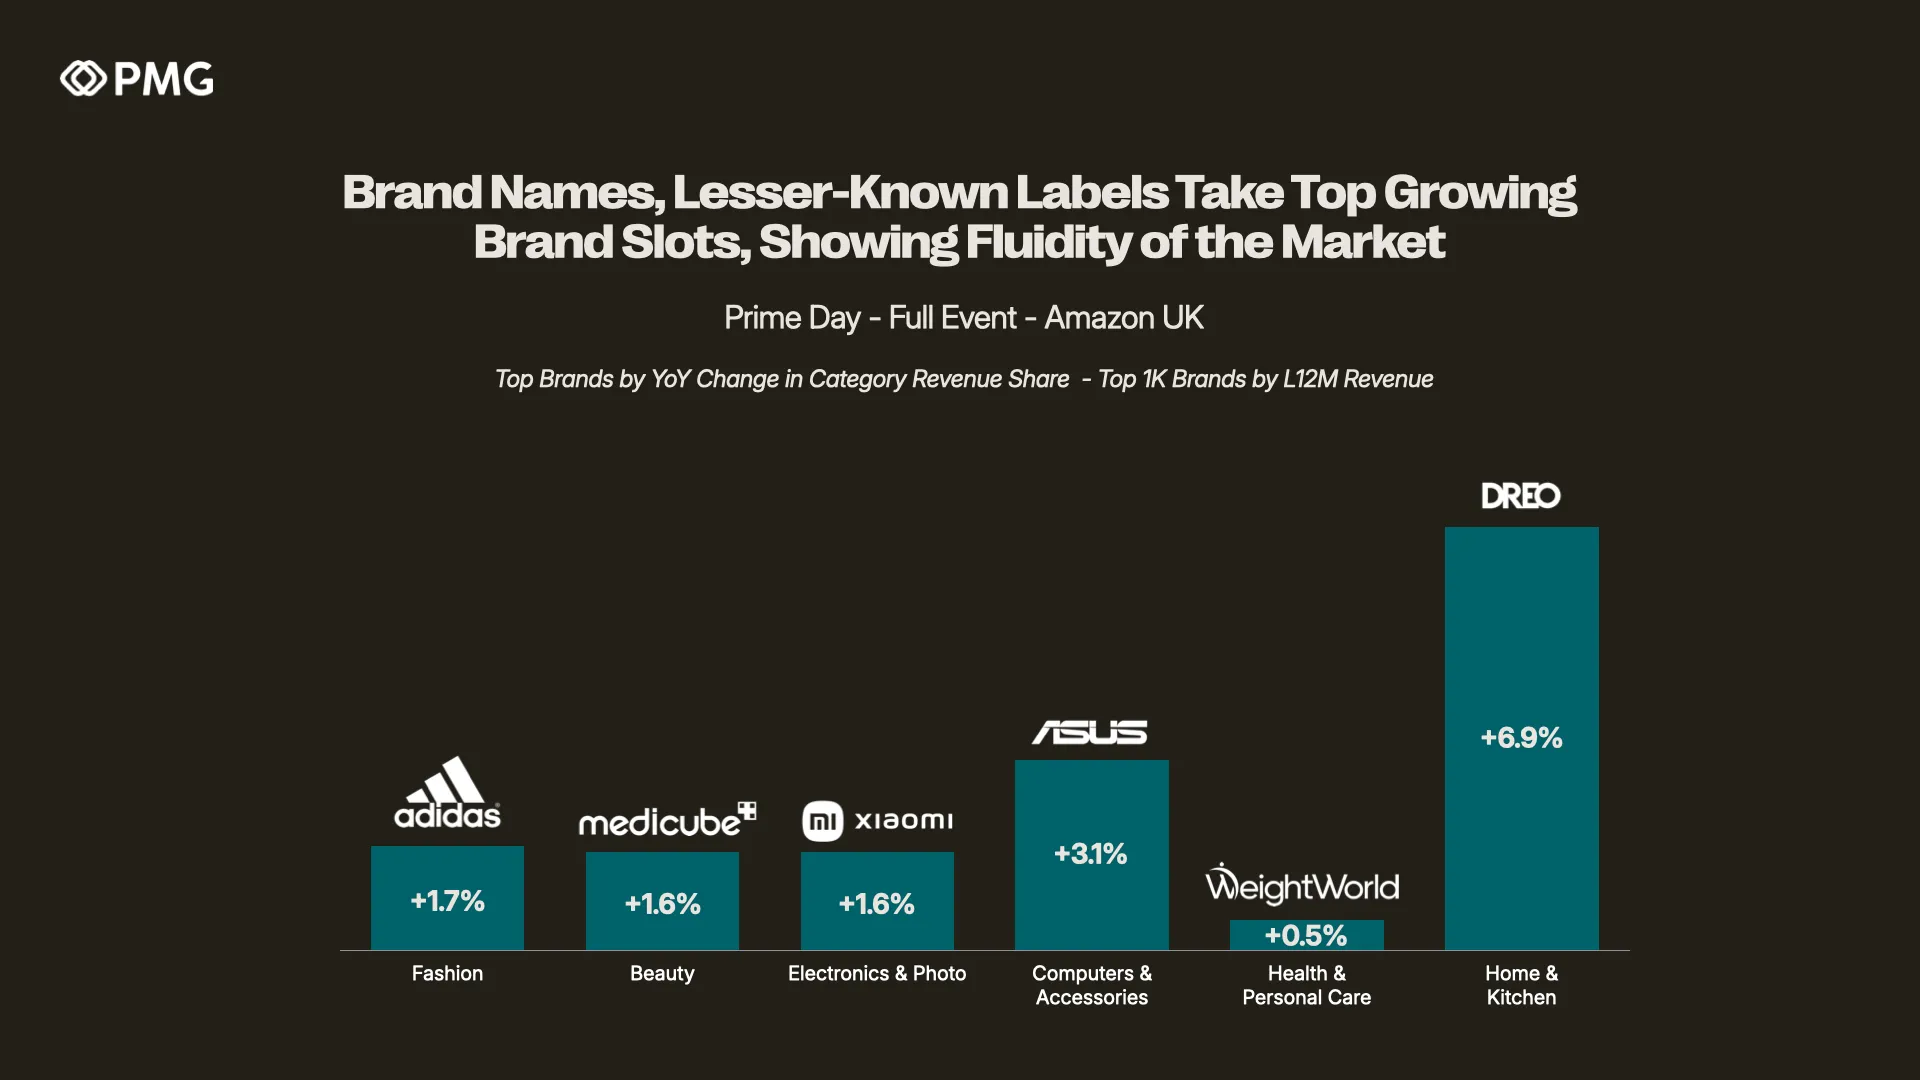
The mix illustrates the dynamic nature of the Amazon marketplace. Global heavyweights like Adidas, ASUS, and Xiaomi sit alongside newer, more specialist labels such as Dreo, Medicube, and WeightWorld as the top growers in their respective categories. That fluidity underscores that incumbency offers no guarantee of market share, and challengers with the right proposition can break through during key sales events like Prime Day. For brands, it’s a reminder that success during peak periods on Amazon is dependent on nuanced, agile strategies, regardless of your brand equity. This includes brand-building campaigns leading up to the event, retail readiness across key products, and sharp positioning for maximum visibility, alongside competitive-aware discount and advertising strategies.
Takeaways for UK Brands From Prime Day 2026
The full-event UK data reinforces that this was a sales event defined by a marked change in what consumers shopped for on average and how much they were willing to pay for those items. Based on these trends, a few implications for brands leading into Q3 and upcoming peak periods:
Plan for continued year-over-year strength in everyday categories. With Grocery (+4.1 pts), Beauty (+3.5 pts), and Fashion (+2.2 pts) all gaining unit share while the Home & Kitchen and tech categories receded, UK demand on Amazon is clearly changing during peak periods. This puts pressure on brands in these categories that may have previously treated Amazon sale events as blips on the calendar to really nail assortment, availability, and merchandising as future sales events approach.
Lead with entry- and mid-price propositions. The decisive migration of revenue into the £10–£25 band, alongside the retreat from the £200-plus tier, means the clearest conversion opportunity sits at the lower end of the price ladder. Particularly in higher AOV categories, brands with a compelling, affordable or mid-tier product line should prioritize optimizations around these products to maximize future event sales volume.
Treat category leadership as contestable. Through things like increased branded search volume, brand equity is an advantage on Amazon, but particularly during peak periods, that advantage is more surmountable. Every brand should take a product-by-product approach to evaluating retail readiness, advertising support, and any discounting to make a product as competitive as possible against its closest competitive set.