
October 5, 2026
Amazon US Prime Big Deal Days 2026 Preview: How to Win as Shoppers Seek More Value
Amazon's Prime Big Deal Days return this October, and shoppers are more price-focused than last year. The trade-down activity we saw in fall 2025 has not reversed: in Q2 2026, year-over-year growth in Amazon US came mostly from essentials, apparel, and beauty. At the 2025 event, brands that paired discounts of 25% or more with greater paid visibility saw the largest revenue gains.
This preview combines PMG's 2025 Prime Big Deal Days retrospective, our analysis of how discounting and paid visibility drove revenue during the 2025 event, and a fresh read on how the Amazon US marketplace has shifted in Q2 2026 versus Q2 2025 to frame what brands should expect and how they should prepare.
The analysis below draws on PMG's proprietary Velocity commerce data, covering pricing, estimated sales, and discount activity across more than 30 million products on Amazon US. Year-over-year comparisons reference the corresponding 2025 periods.
The Backdrop: Shoppers Trading Down in Essentials, Up in Discretionary
Value consciousness became a real theme on Amazon US in late 2025, and it’s since developed into a wider trend in 2026. During the 2025 Prime Big Deal Days event, the average selling price (ASP) of top-selling products on Amazon US fell at the steepest year-over-year rate of the year (excluding the Prime Day week, when the dates were misaligned). That drop came following a stretch from the weeks ending March 29 through October 4, 2025, during which ASPs declined YoY in 24 of 28 weeks. Units sold grew a healthy +17% YoY, but revenue growth for the event week came in at just +3% YoY, a sharp deceleration from the +13% YoY growth registered between the 2023 and 2024 events. The average consumer kept buying but chose less expensive products.
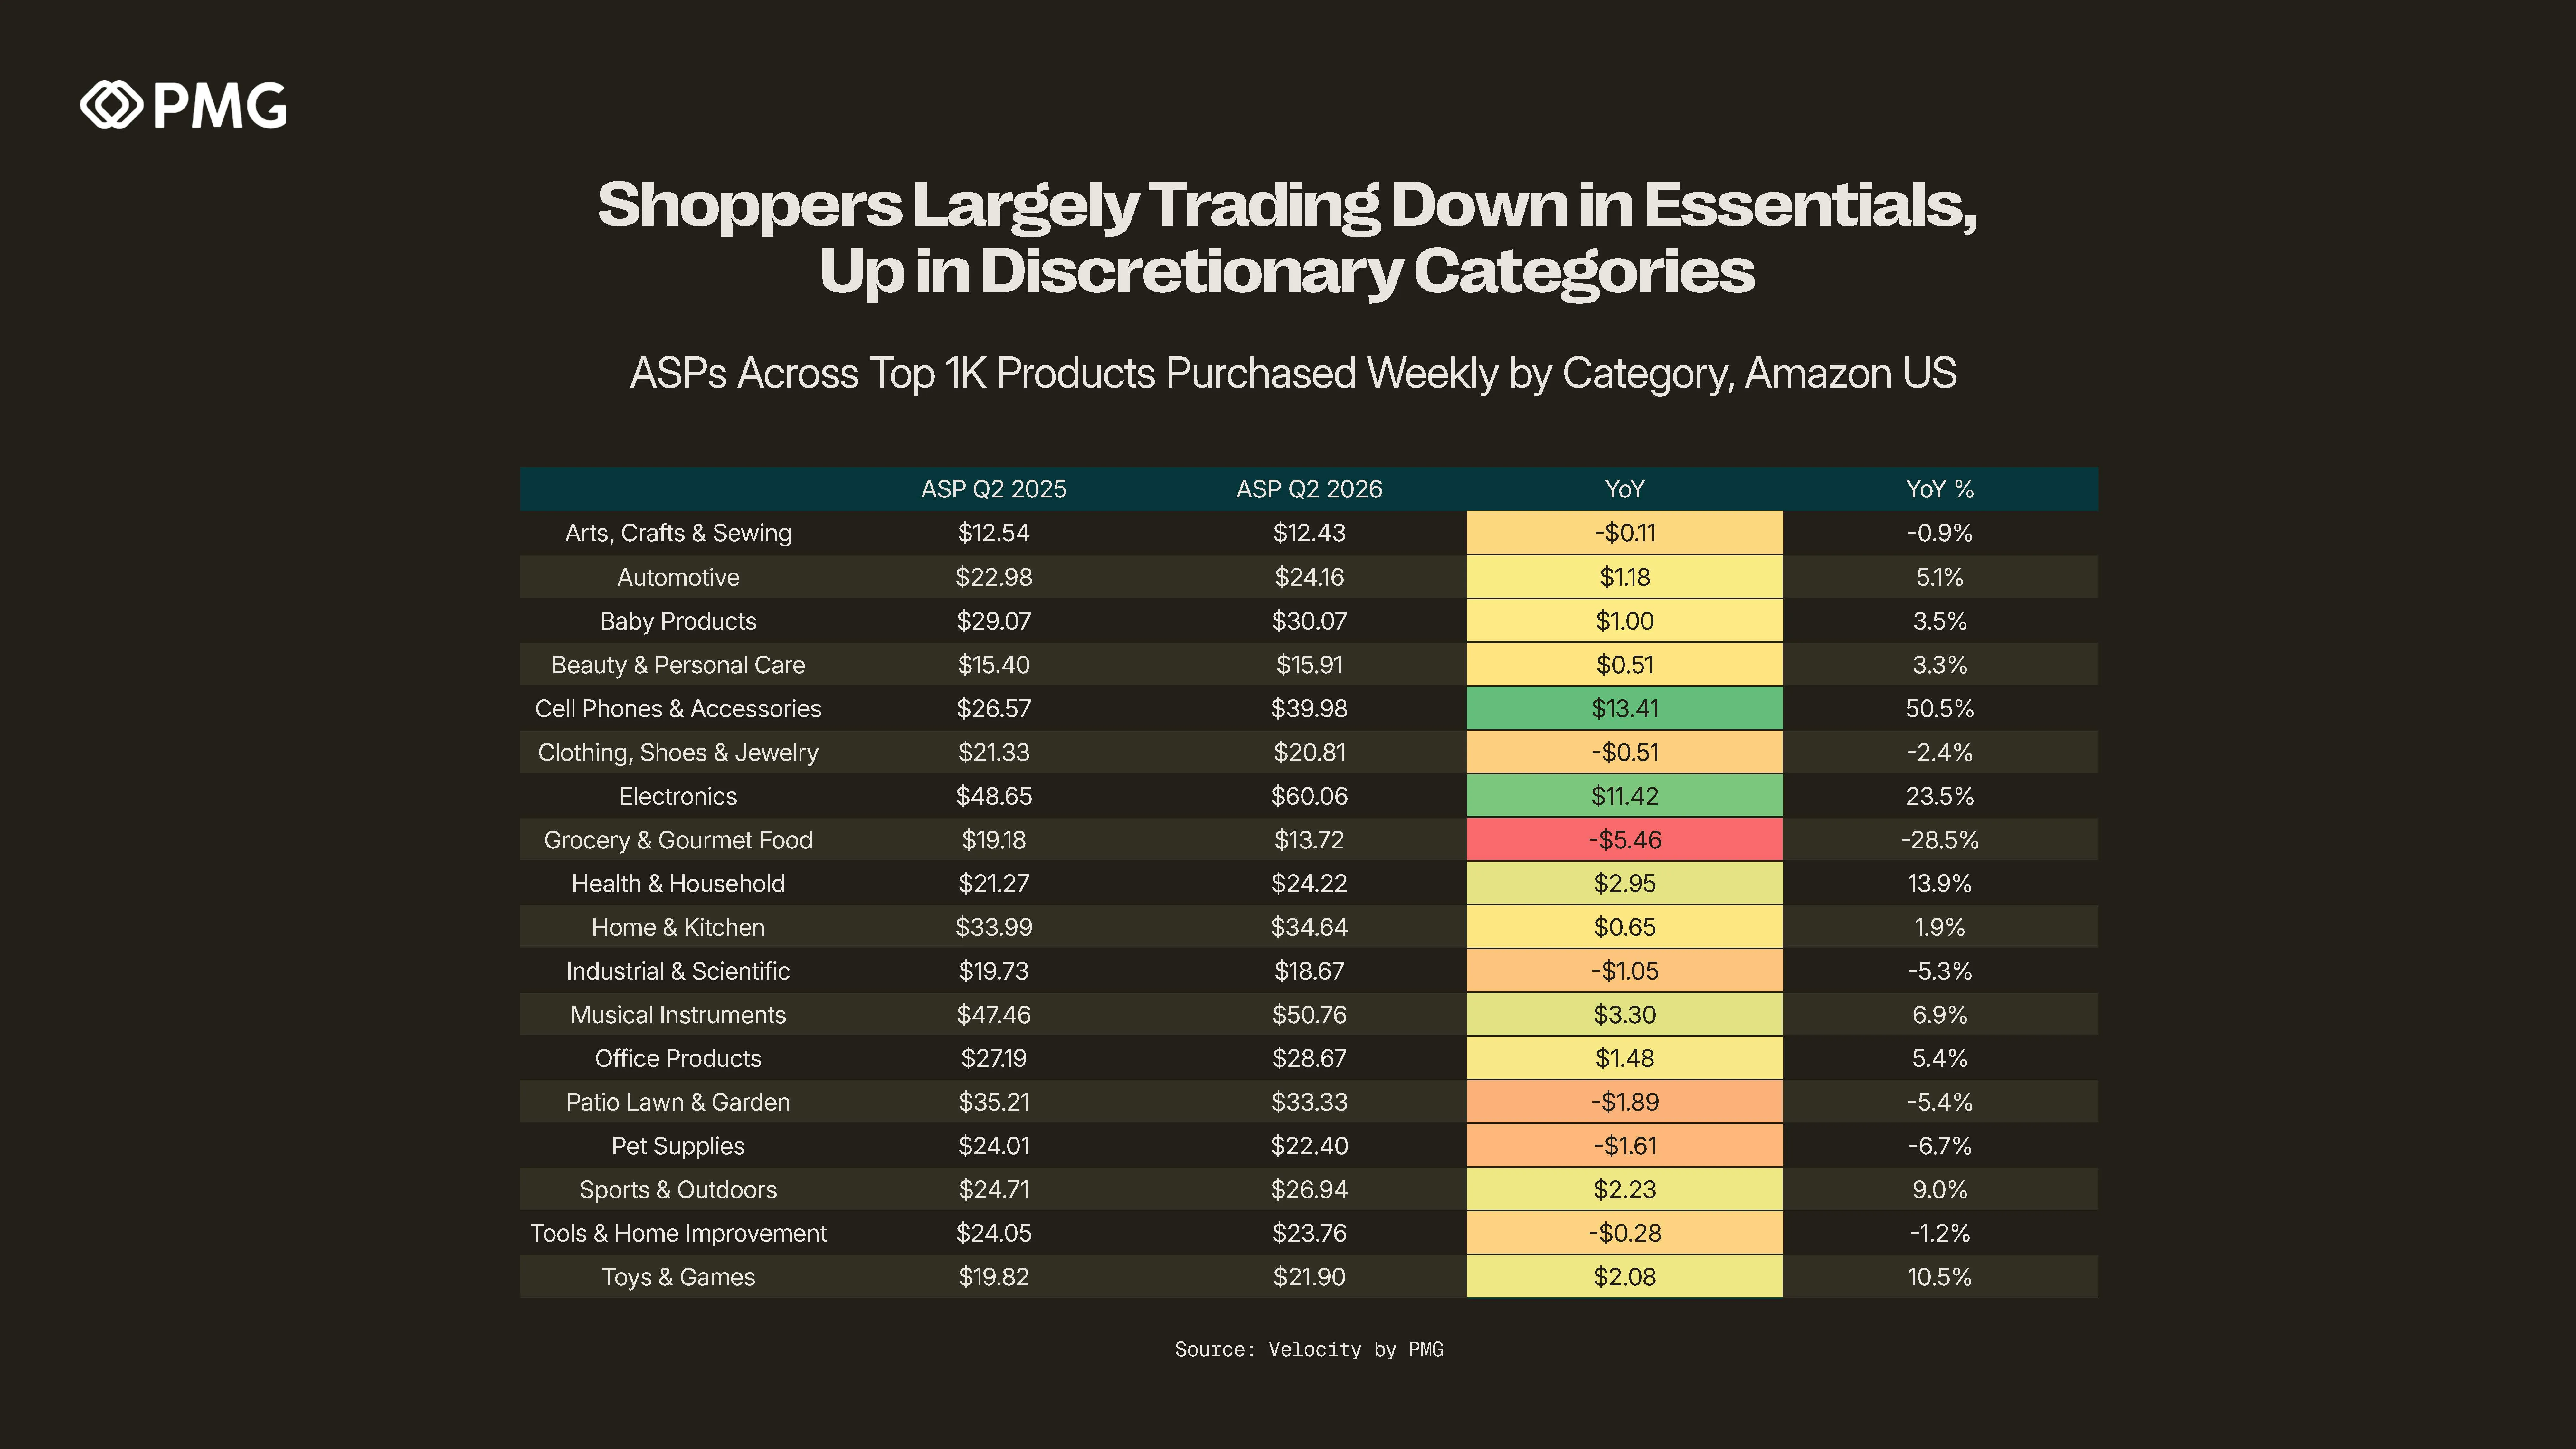
That behavior became more category-specific throughout 2026. Our Q2 2026 marketplace read shows overall Amazon US revenue up 15% YoY, but that growth is concentrated in essentials and value-oriented categories rather than higher-consideration discretionary goods. Meanwhile, many essentials categories are seeing continued ASP declines across top-purchased products, indicating that consumers are increasingly reaching for lower-priced products in these verticals. A number of discretionary categories are, conversely, experiencing ASP increases on the same measure, likely in part due to outsized tariff and inflationary impacts.
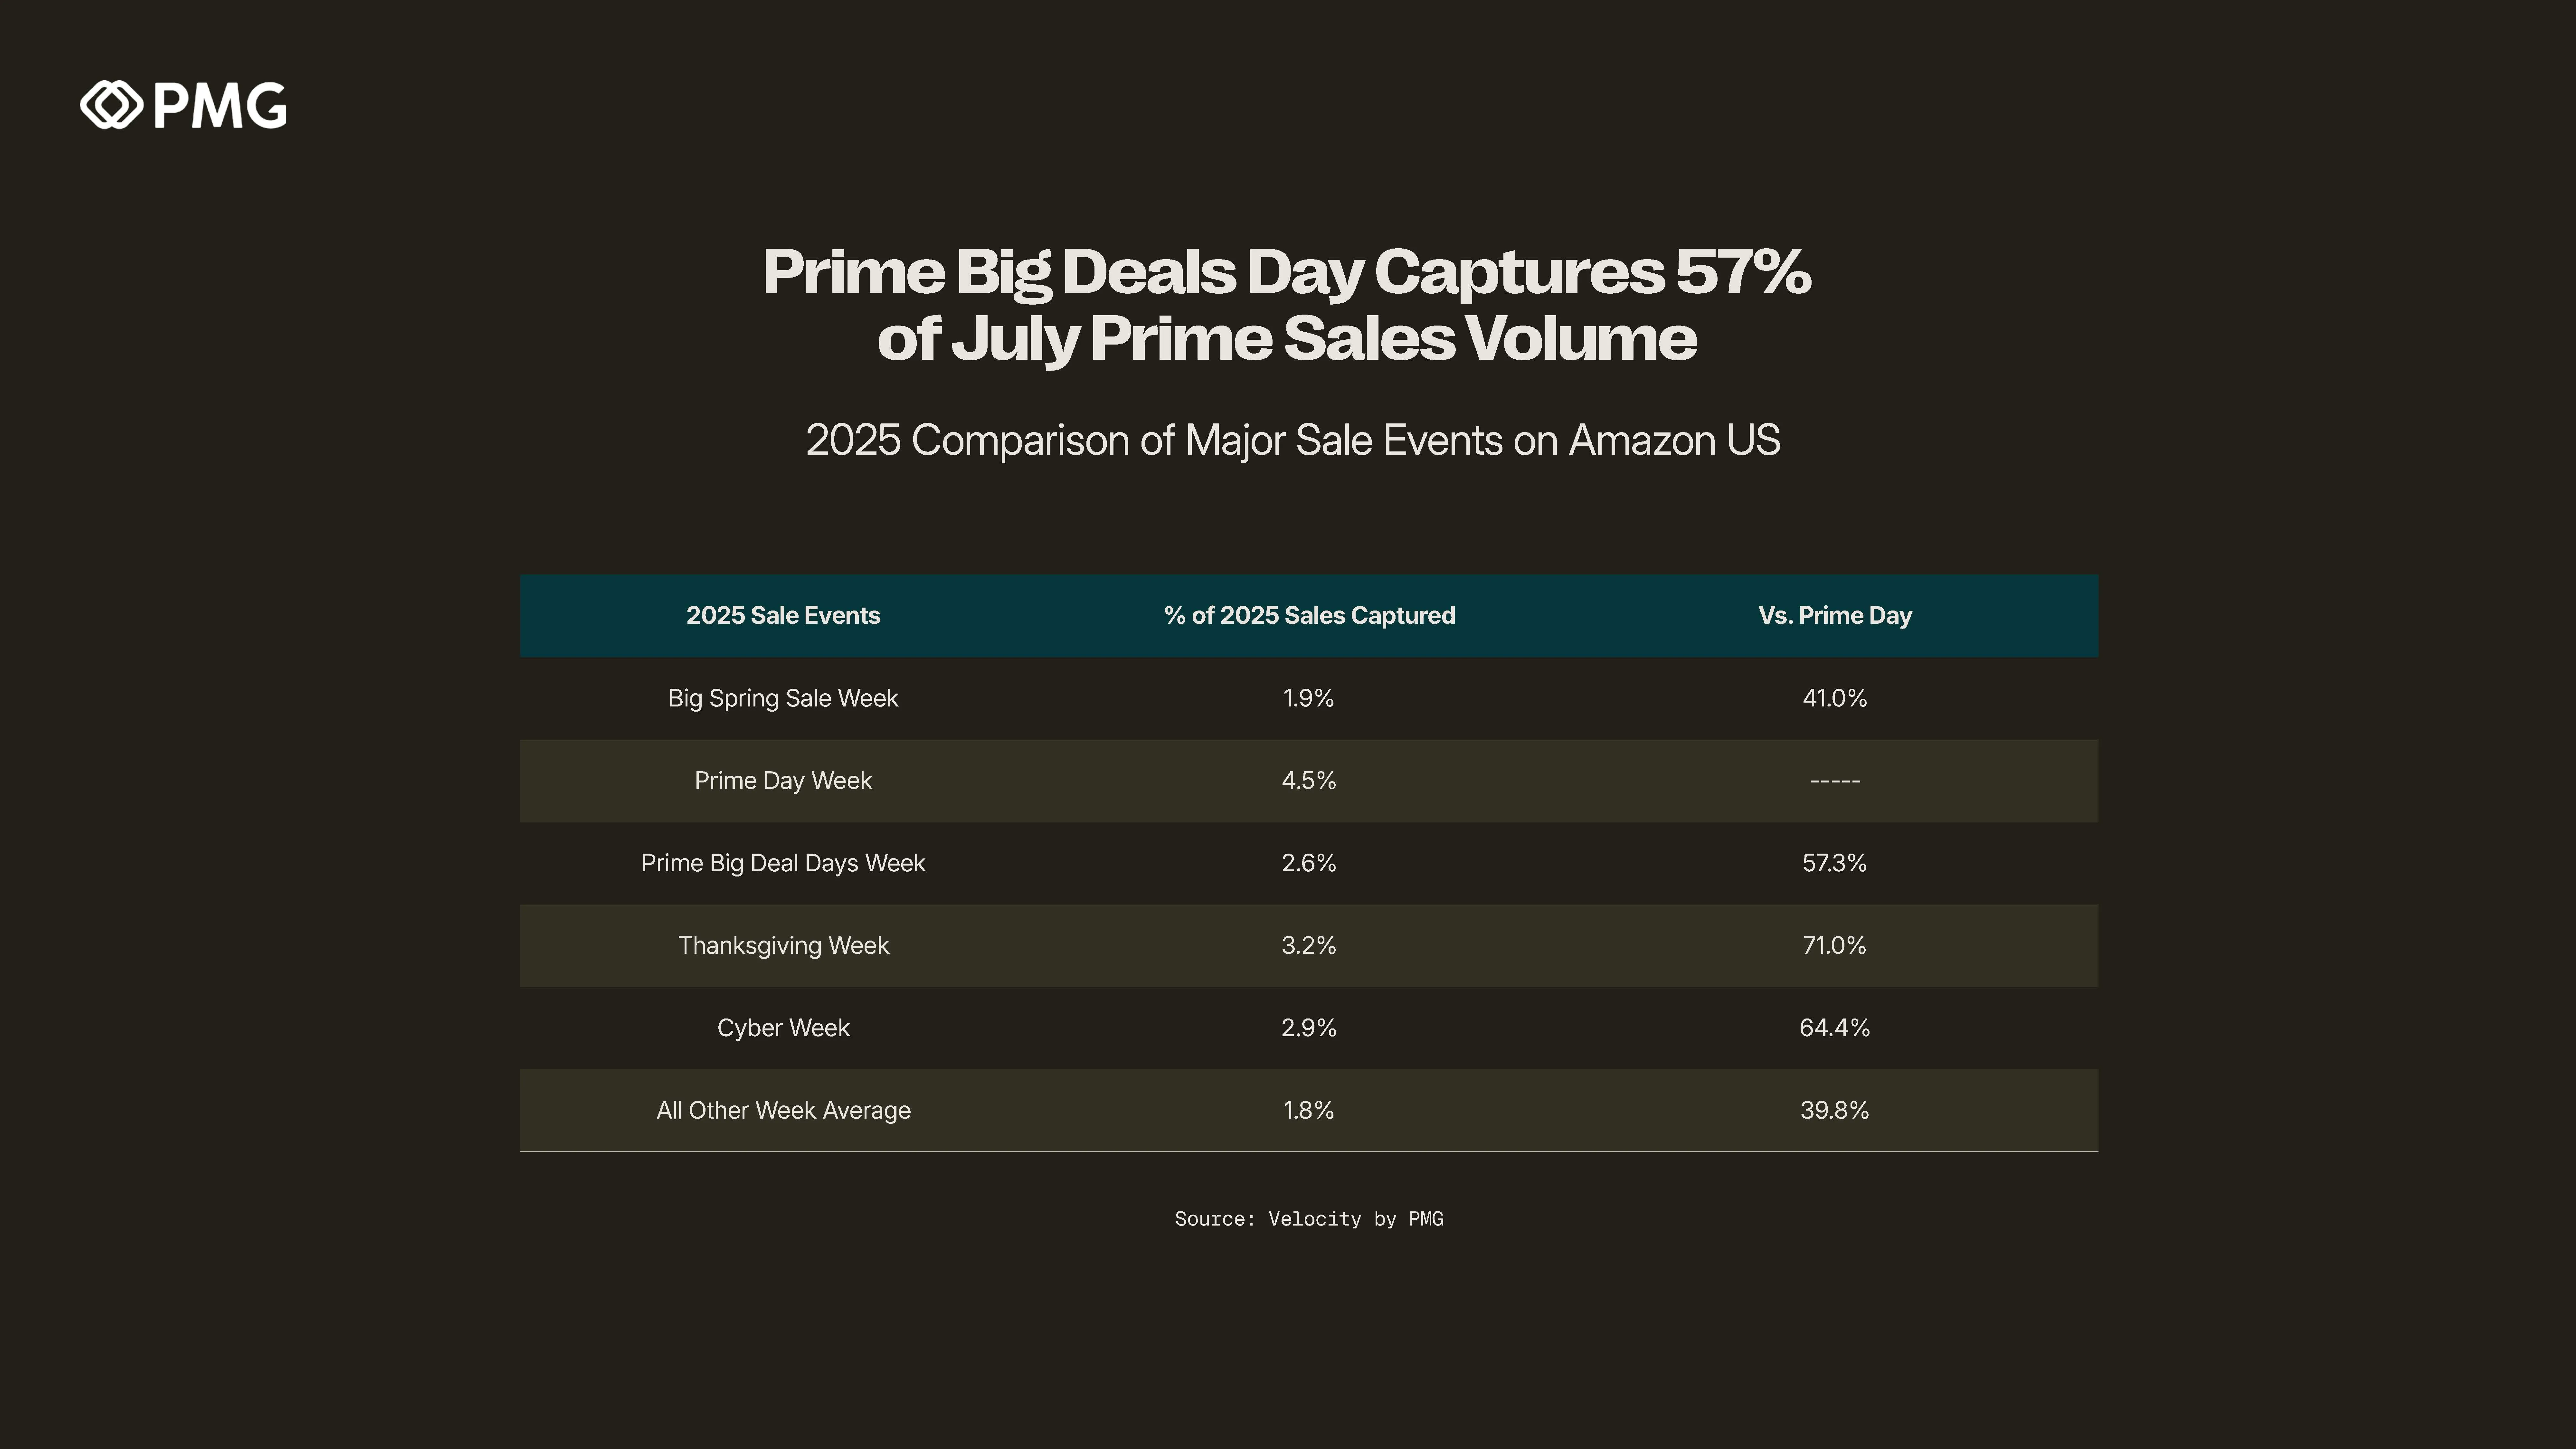
Zooming out, Prime Big Deal Days week accounts for roughly 3% of annual Amazon US sales, about 57% of the volume of Prime Day week. It remains a tentpole worth planning around, though brands need to execute against more disciplined strategies, including seeding demand before the event, to maximize their return.
Where Growth Is Landing in 2026: Essentials & Apparel Take Share
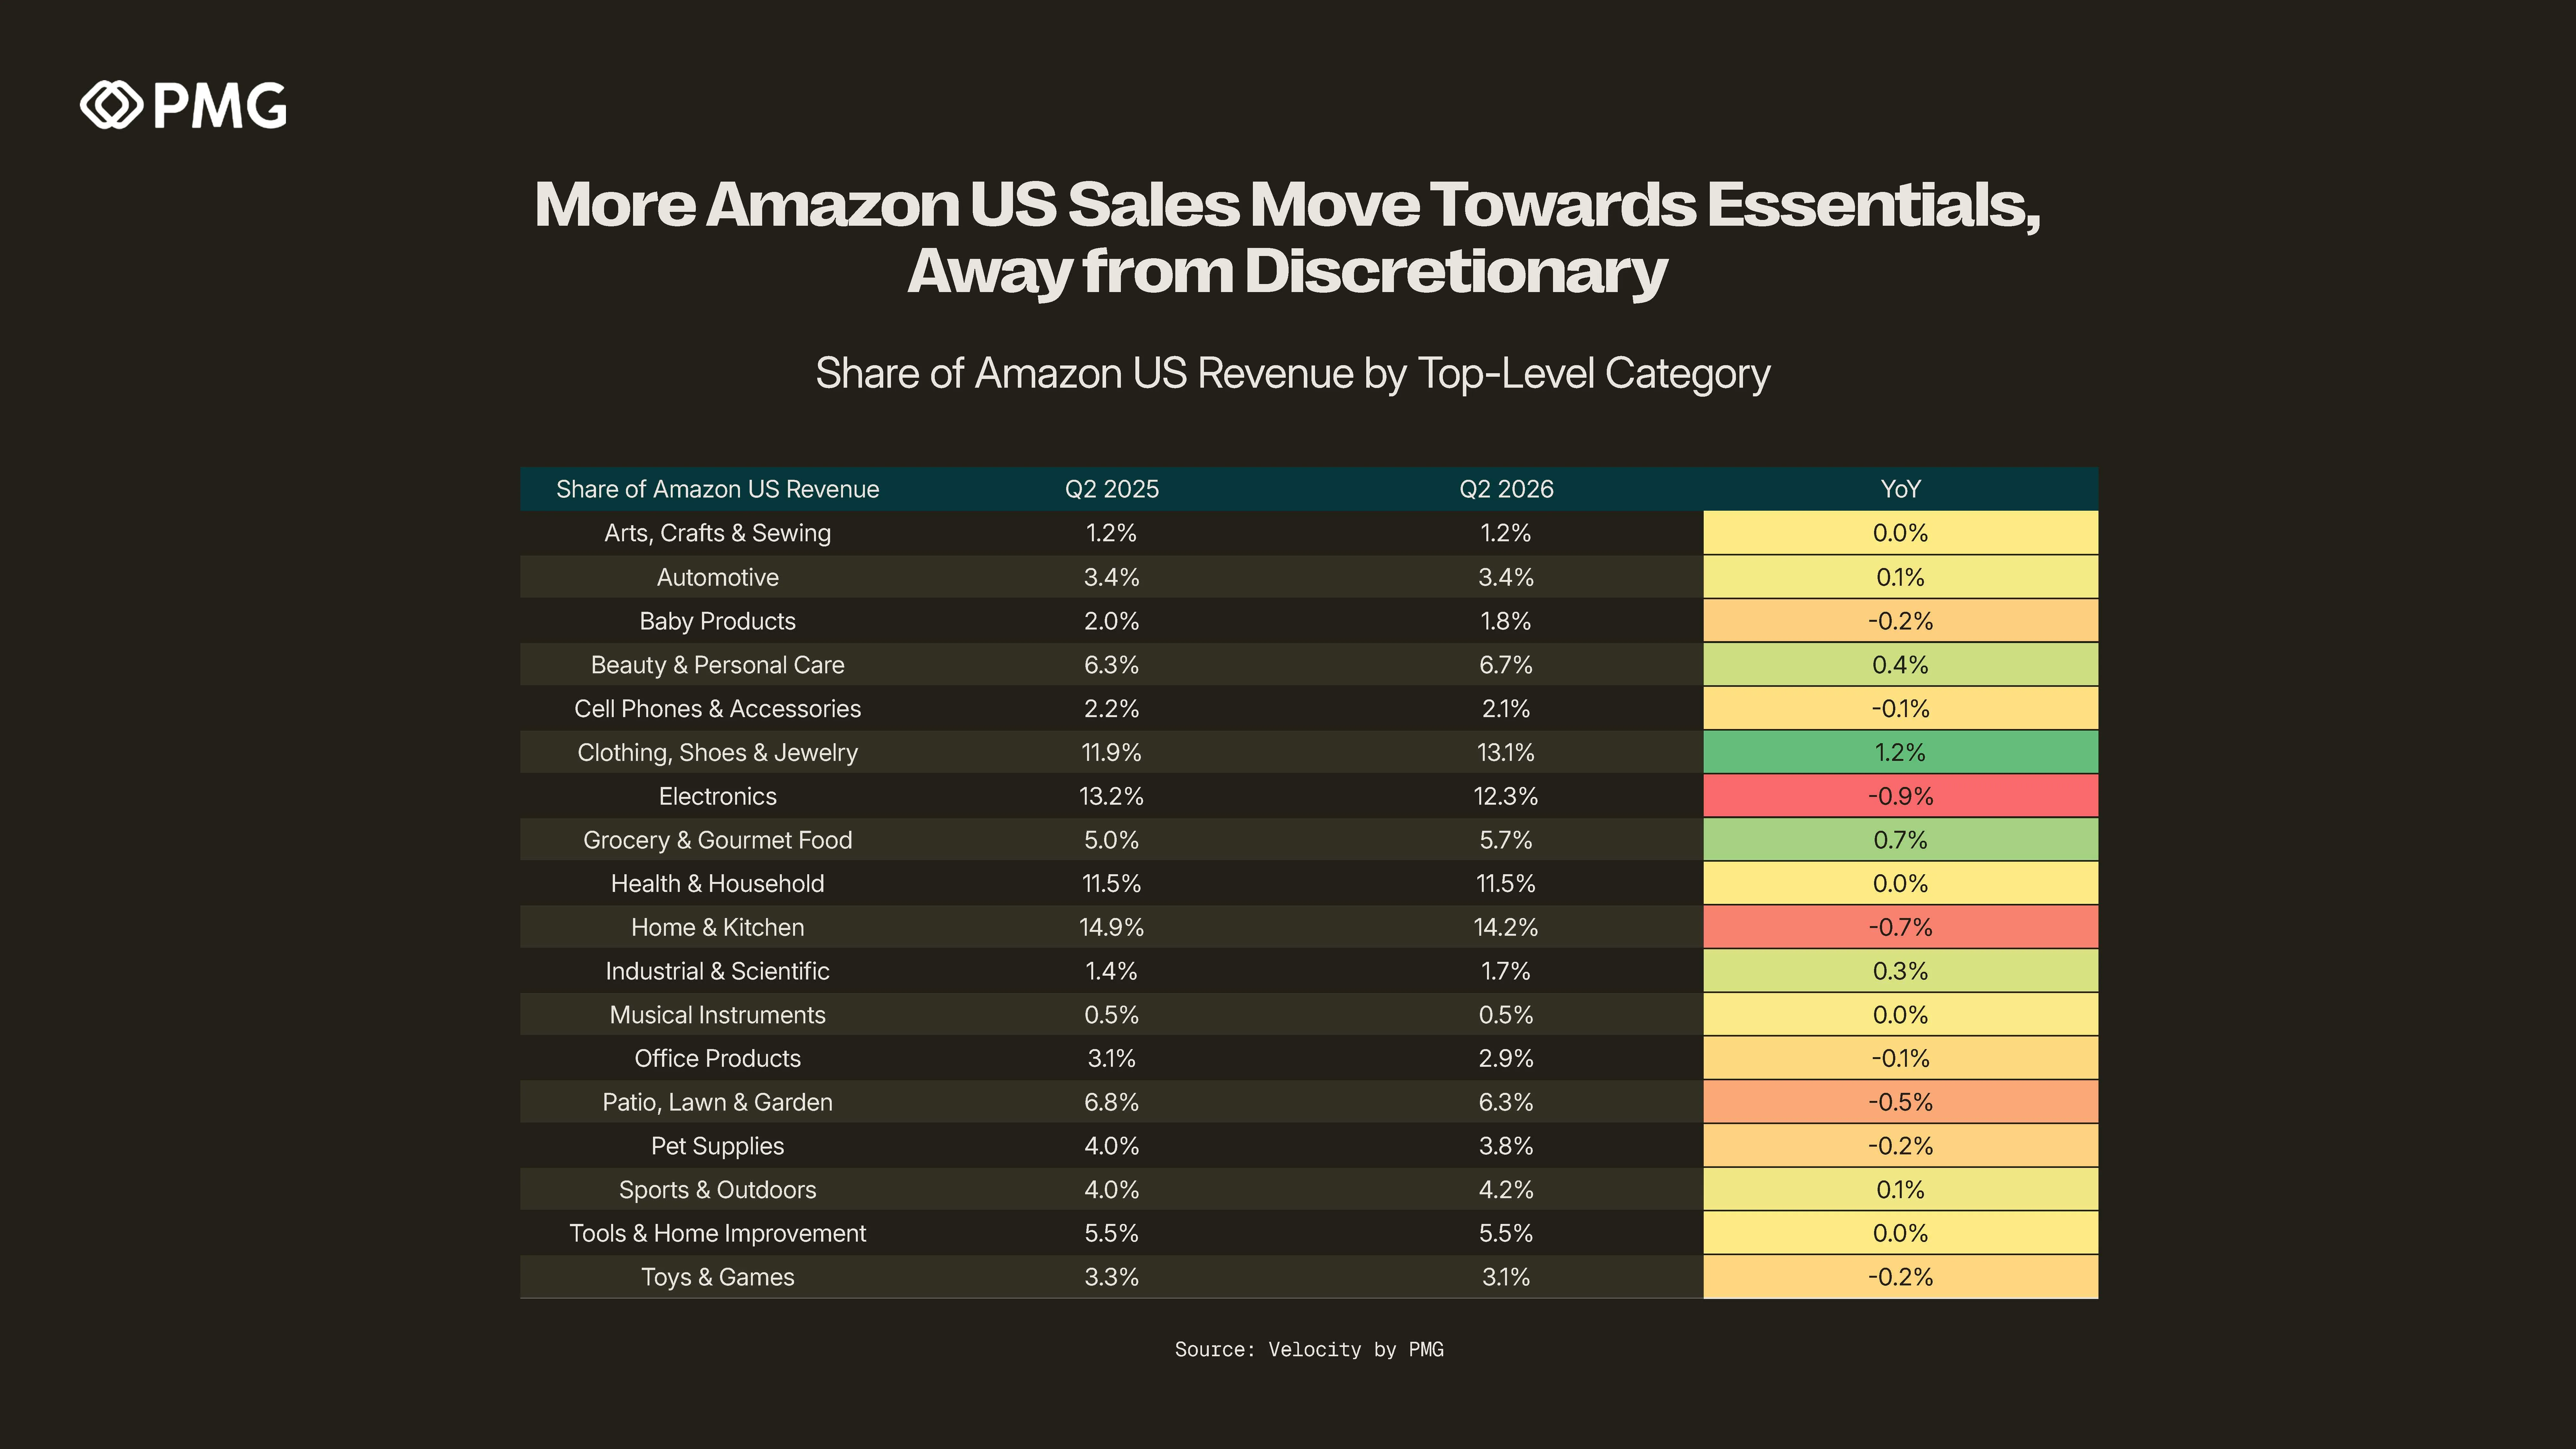
The clearest signal for how to prioritize this Prime Big Deal Days event within the wider holiday season comes from the shifting category mix on Amazon US. Comparing each category's share of total Amazon US revenue in Q2 2026 versus Q2 2025 reveals a clear tilt toward essentials, replenishment, and value-driven categories, with bigger-ticket discretionary verticals declining in share.
Categories gaining revenue share (Q2 2026 vs. Q2 2025)
Clothing, Shoes & Jewelry — rising from 11.9% to 13.1% of site revenue (+1.2 percentage points), the biggest share gain of any major category, along with +27% YoY category revenue growth. When breaking down sales by price band, growth in this category was overwhelmingly led by items priced below $50.
Grocery & Gourmet Food — up from 5.0% to 5.7% of revenue (+0.7 percentage points), with the fastest ASP decline on the site across top-selling products (-28% YoY) and +32% YoY revenue growth
Beauty & Personal Care — up from 6.3% to 6.7% of revenue (+0.4 points), on +22% YoY growth
Categories losing revenue share (Q2 2026 vs. Q2 2025):
Electronics — the largest decliner, slipping from 13.2% to 12.3% of Amazon US revenue (-0.9 percentage points), with category growth of just +7% YoY even as the ASP of top-selling products rose sharply
Home & Kitchen — down from 14.9% to 14.2% (-0.7 percentage points) on modest +10% YoY growth
Patio, Lawn & Garden — slipped from 6.8% to 6.3% share of overall Amazon US revenue (-0.5 points), while the ASP of top-selling products also declined by 5% YoY.
These trends reinforce last year's finding that Amazon is becoming structurally stronger in essentials. Notably, several categories bleeding share, with Electronics most prominent, are also the ones where ASPs of top-selling products rose year over year (e.g., Electronics ASP +23%, Cell Phones & Accessories +50%). This suggests that higher price tags, whether due to tariffs or general inflation, are softening aggregate demand as shoppers hunt for value. For brands in these higher-ASP, higher-consideration categories, the ability to discount effectively over Prime Big Deal Days will loom especially large.
The Discount Environment: Shallower, but Depth Still Wins
Last year established the tension brands are still navigating in 2026. While consumers are trading down, many brands are not offering larger discounts. Average discount depth during Prime Big Deal Days fell from 28% in 2024 to 24% in 2025, likely pressured by tariffs, rising supply-chain costs, and higher Amazon deal fees. That compression of average discount depth has continued. PMG’s Prime Day 2026 analysis shows discount depth easing further, and the share of promotions settling in the shallower, sub-20%-off band growing the fastest of all deal tiers.
Even as average discounts drop, deal depth still matters. Our analysis of the 2025 Prime Big Deal Days event found that steeper discounts were associated with larger revenue gains, with the strongest growth coming from brands offering 25% or more off, with the best results at 30% or higher. Critically, the winning formula came down to combining those discounts with additional paid visibility.
Brands that combined increased discount rates with a meaningful lift in paid visibility (increases of 10–30% or more in paid search appearances) saw the most pronounced revenue gains the week of Prime Big Deal Days 2025.
This held across categories, including Beauty & Personal Care, where top revenue performers clustered in the heavier-discount buckets. Brands that paired those cuts with larger increases in paid search appearances tended to see the best gains.
The implication for 2026 is that discounting and media should be planned as a single, integrated go-to-market rather than two separate ones. In a marketplace where the typical deal is getting shallower, a genuinely competitive discount backed by greater visibility can break through.
What Brands Should Do to Prepare for Prime Big Deal Days 2026
Four priorities follow from the data for brands preparing for this year's Prime Big Deal Days.
Treat Prime Big Deal Days as the Opening Leg of a Long Race
The weeks of Prime Day and those surrounding Thanksgiving and Cyber Monday historically outpace Prime Big Deal Days, and that will not change in 2026. Additionally, the "doorbuster" mentality among US consumers is fading. During Prime Day 2026, a smaller share of event sales occurred on Day 1 than in previous years, as shoppers waited for the right deal. Amazon itself reinforces this behavior by personalizing deal pages and stretching promotional windows before and after headline events. Consider running discounts following the event, even if that means slightly lighter depth. Consumer response over Prime Big Deal Days can help you hone your strategy for the holiday peak and build media pacing around a longer holiday demand curve.
Anchor Discounts to Competitive-but-Sustainable Thresholds
Consumers reward discount depth. While 25–29% discounts tended to drive better 2025 outcomes, discounts of 30% or more were associated with the best performance on average. That said, the optimal rate should depend on your margins and the competitive environment for each product. With Amazon US consumers more focused on value and Amazon’s own AI tools now exposing a full year’s worth of price history for a product, a shallow discount is easy to spot and unlikely to move sales. Model deeper cuts against your own seasonal performance data to identify the point at which sales velocity justifies the margin trade-off.
Support Discounts with a Lift in Paid Visibility
Shoppers now see a deal page personalized to them, so a deep discount no longer reaches everyone by default. Instead, a clear lesson from 2025 is that discounting and paid presence work best together. Brands that raised paid visibility 10–30% alongside their promotions tended to see the strongest revenue gains. To get your products on more deal pages during the event, it’s important to drive views during the lead-in period by seeding demand early through DSP and other top-of-funnel channels, then focus search and display support on your discounted products during the high-intent window.
Put Ad Support Behind Your Price-Competitive Products
With AI tools making it easier for more shoppers to compare prices within Amazon and across retailers, more advertising support should flow to price-competitive products rather than higher-margin items. The Q2 2026 share shifts point to essentials and apparel (Clothing, Shoes & Jewelry, Grocery & Gourmet Food, Beauty & Personal Care) as categories where that leverage is greatest. In slower-growing categories like Electronics and Home & Kitchen, lead with price and be selective about where you spend.
MethodologyThe data described above is collected from over 30 million products on Amazon US, according to Velocity, PMG’s proprietary commerce platform. ASP data reflects the top 1,000 products by revenue each week across each top-level physical products category. Estimated sales figures are presented as weekly and quarterly data, along with year-over-year change comparisons. Discount data includes both Prime Day-specific deals and general promotional discounts across the same set of 30 million products.
To assess the revenue impact of promotional strategies during Prime Big Deal Days, PMG analyzed weekly Amazon US sales estimates, daily paid search appearances, and daily average prices from September 14 through October 11, 2025, across the top 10,000 brands by September 2025 monthly revenue. Brands were then segmented into buckets based on changes in average discount-adjusted price and daily total brand paid search appearances observed during Prime Day Big Deal Days 2025 (October 7-8), compared with the three-week average preceding the sale event (September 14-October 4).
Comparative revenue change figures reflect the median period-over-period change in estimated weekly sales across all brands in each respective discount and paid appearance change bucket.