
October 28, 2026
Plan for the Season, Not Just the Sale: The 2026 Amazon Prime Big Deal Days US Retrospective & Cyber Week 2026 Preview
What Amazon US Prime Big Deal Days 2026 tells brands about the holiday ahead
Amazon US Prime Big Deal Days week revenue rose 10.0% year over year, matching the growth of the four weeks before it. Demand is entering the holidays with momentum, but the October event did not outgrow that underlying trend. Based on these results, a clear lesson for holiday 2026 is to plan around category demand across the season, rather than rely on Cyber Week alone to deliver growth.
For brand leaders, the opportunity is to pair compelling offers with the weeks their customers are most likely to buy, while protecting inventory and investment beyond the headline sale.
Three findings should shape planning:
Prime Big Deal Days growth tracked the underlying market
Holiday demand has stayed elevated after Cyber Week
Promotional execution was associated with very different outcomes.
PMG's Velocity analysis of more than 30 million products on Amazon US points to a season that requires selective product-level decisions, not a blanket increase in discounting.
A Stronger Market Is Not a Guarantee of an Event Windfall
Prime Big Deal Days signals resilient demand, not a reason to assume the sale itself will create extra growth. Event-week revenue and the preceding four-week baseline both grew 10.0% year over year. That dynamic underscores a useful distinction for budgeting, in that brands should separate the growth they would expect from the marketplace from the additional sales and contribution their promotions need to generate. An event-week revenue increase alone cannot establish incrementality.
The headline growth also masks very different shopper priorities. Grocery shoppers bought 37.7% more units while the category's average selling price fell 13.1%; Electronics was broadly flat on revenue. Those results argue against treating October performance as a uniform holiday demand signal.
Essentials brands should test pack value and price competitiveness, while gift-oriented brands should use their own category's holiday calendar to set expectations, rather than broadly infer weak December demand from a flat October event.
Protect the Weeks After Cyber Week
Cyber Week remains an anchor, but it is not the end of the holiday opportunity. In 2025, Amazon US revenue during Thanksgiving and Cyber Monday weeks reached 1.72 and 1.76 times September's weekly average. The next two weeks remained at 1.65-1.68 times that baseline. The two Cyber Week weeks accounted for 30.8% of the measured November-December window, versus 31.6% in 2024. That modest share shift is less important than the sustained December sales level: looming ahead, brands should avoid exhausting budgets or stock on Cyber Monday.
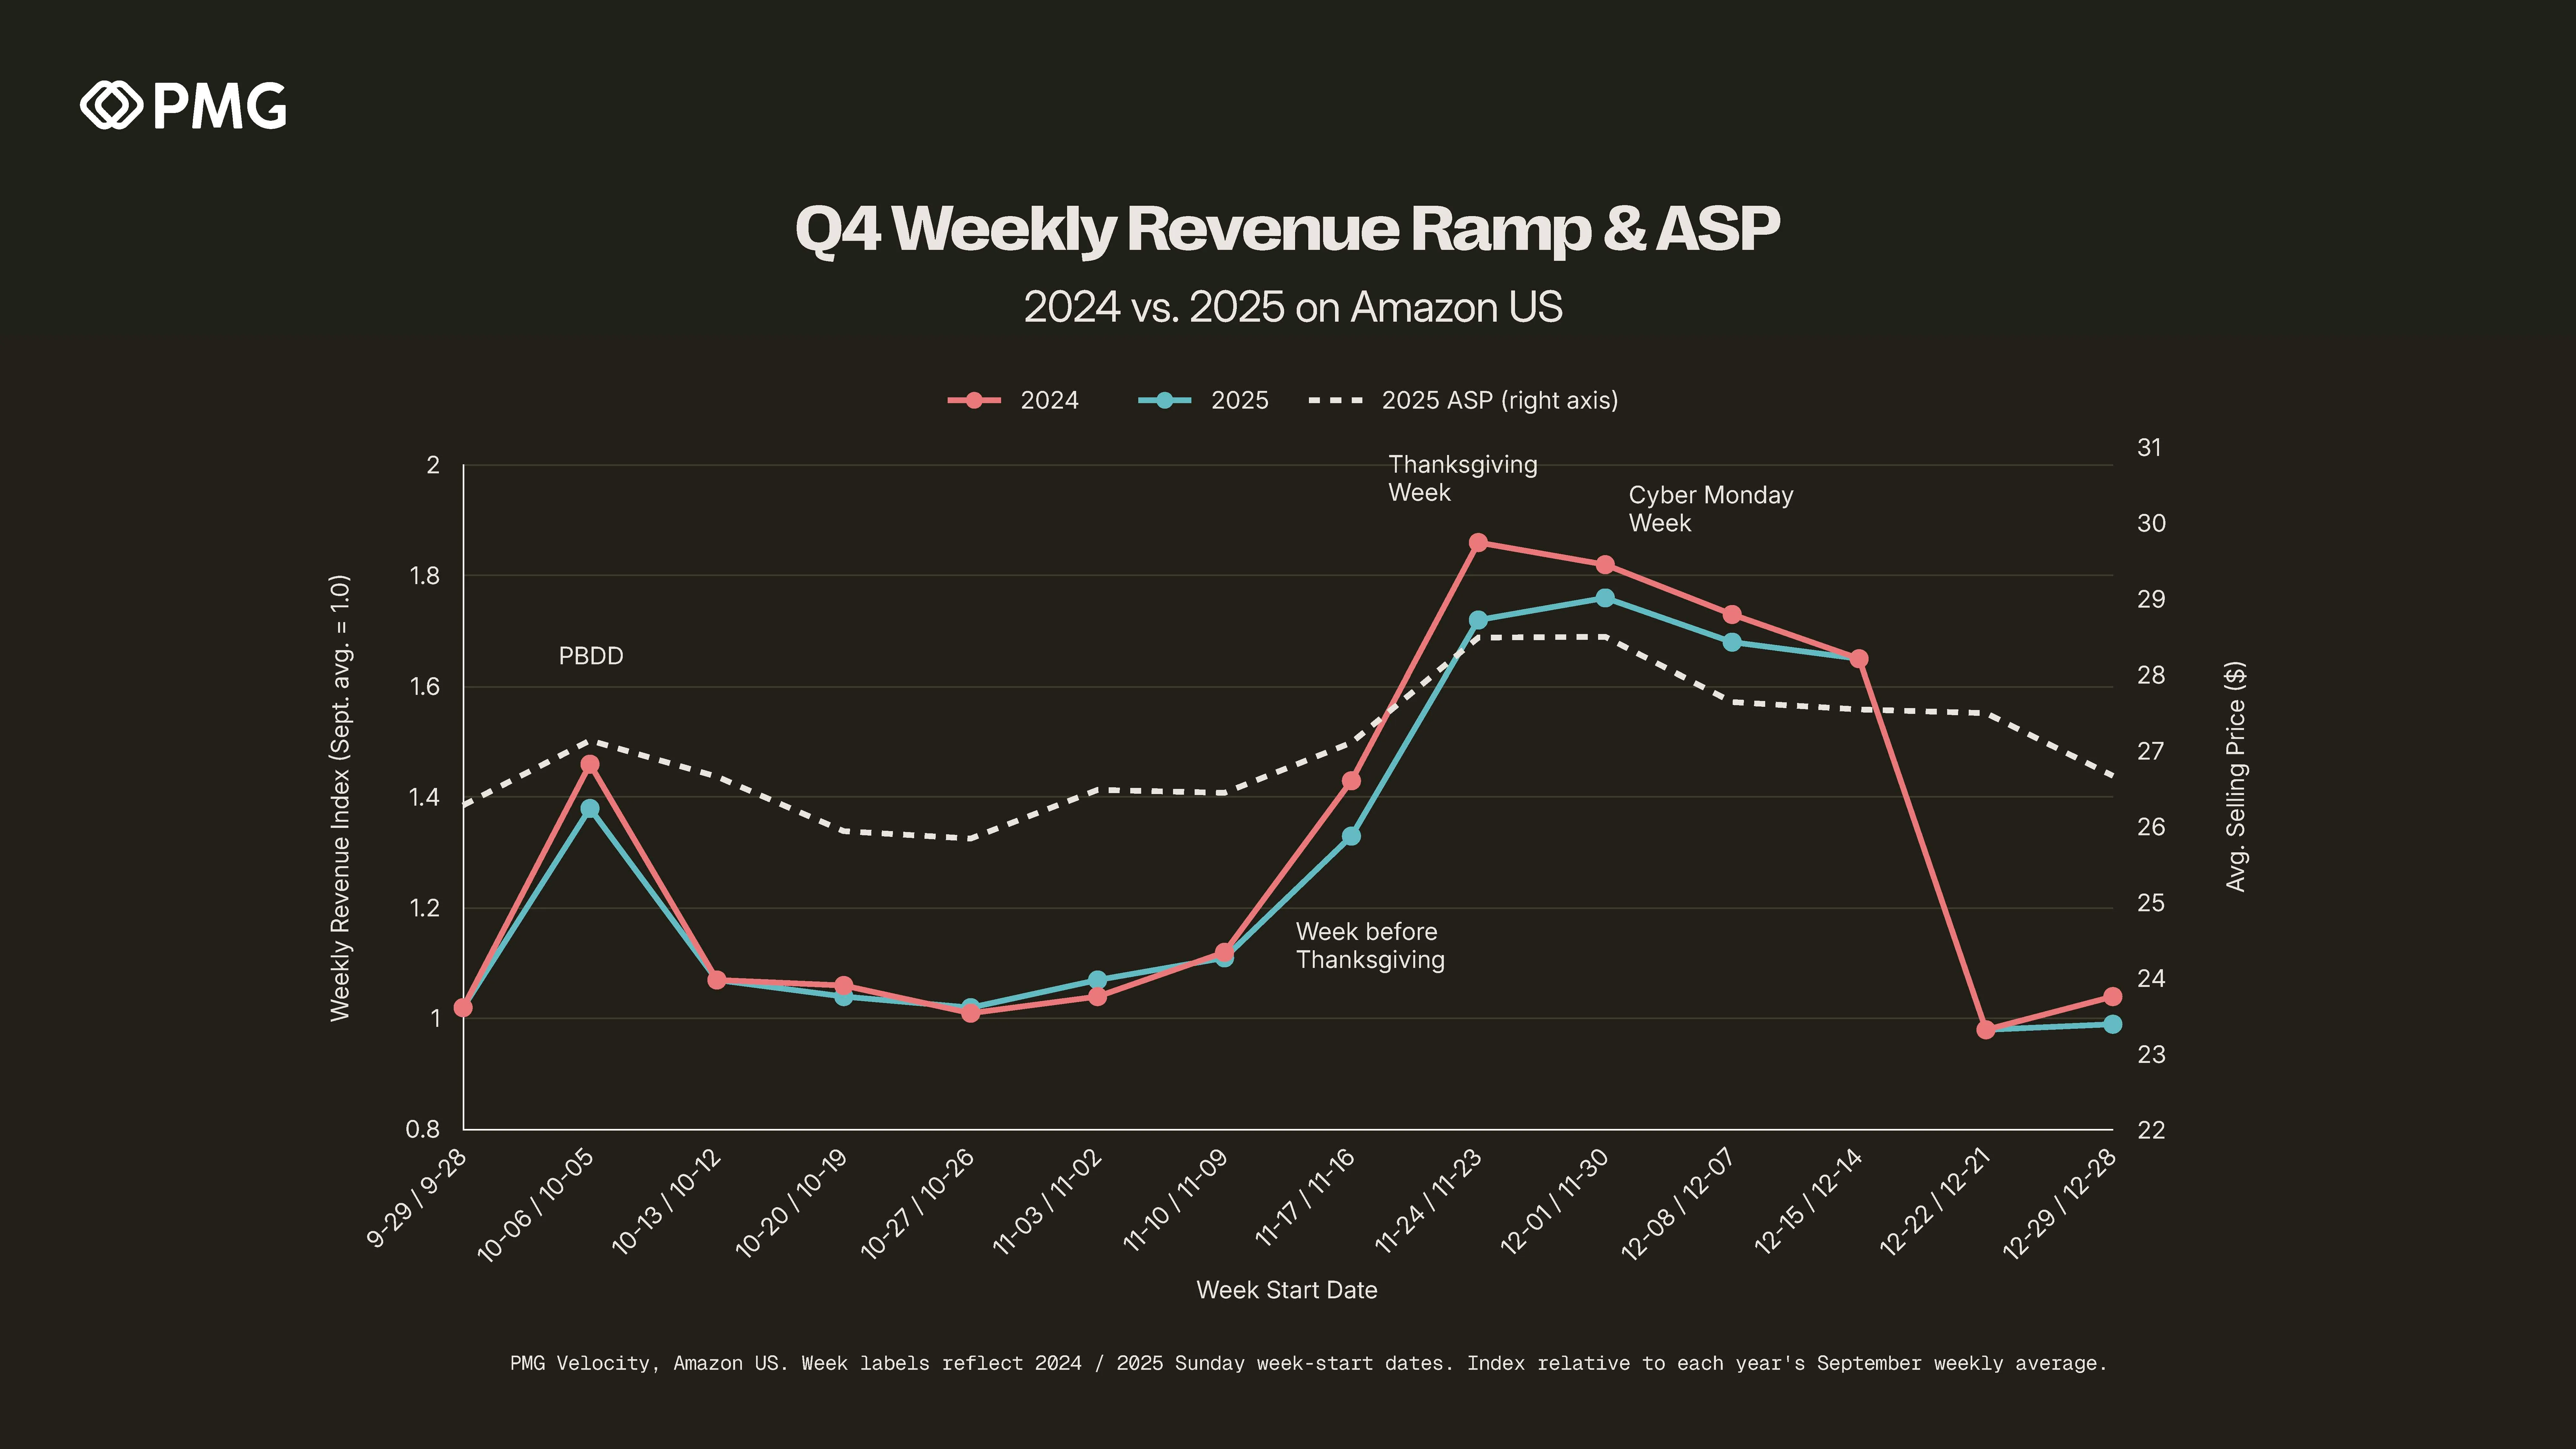
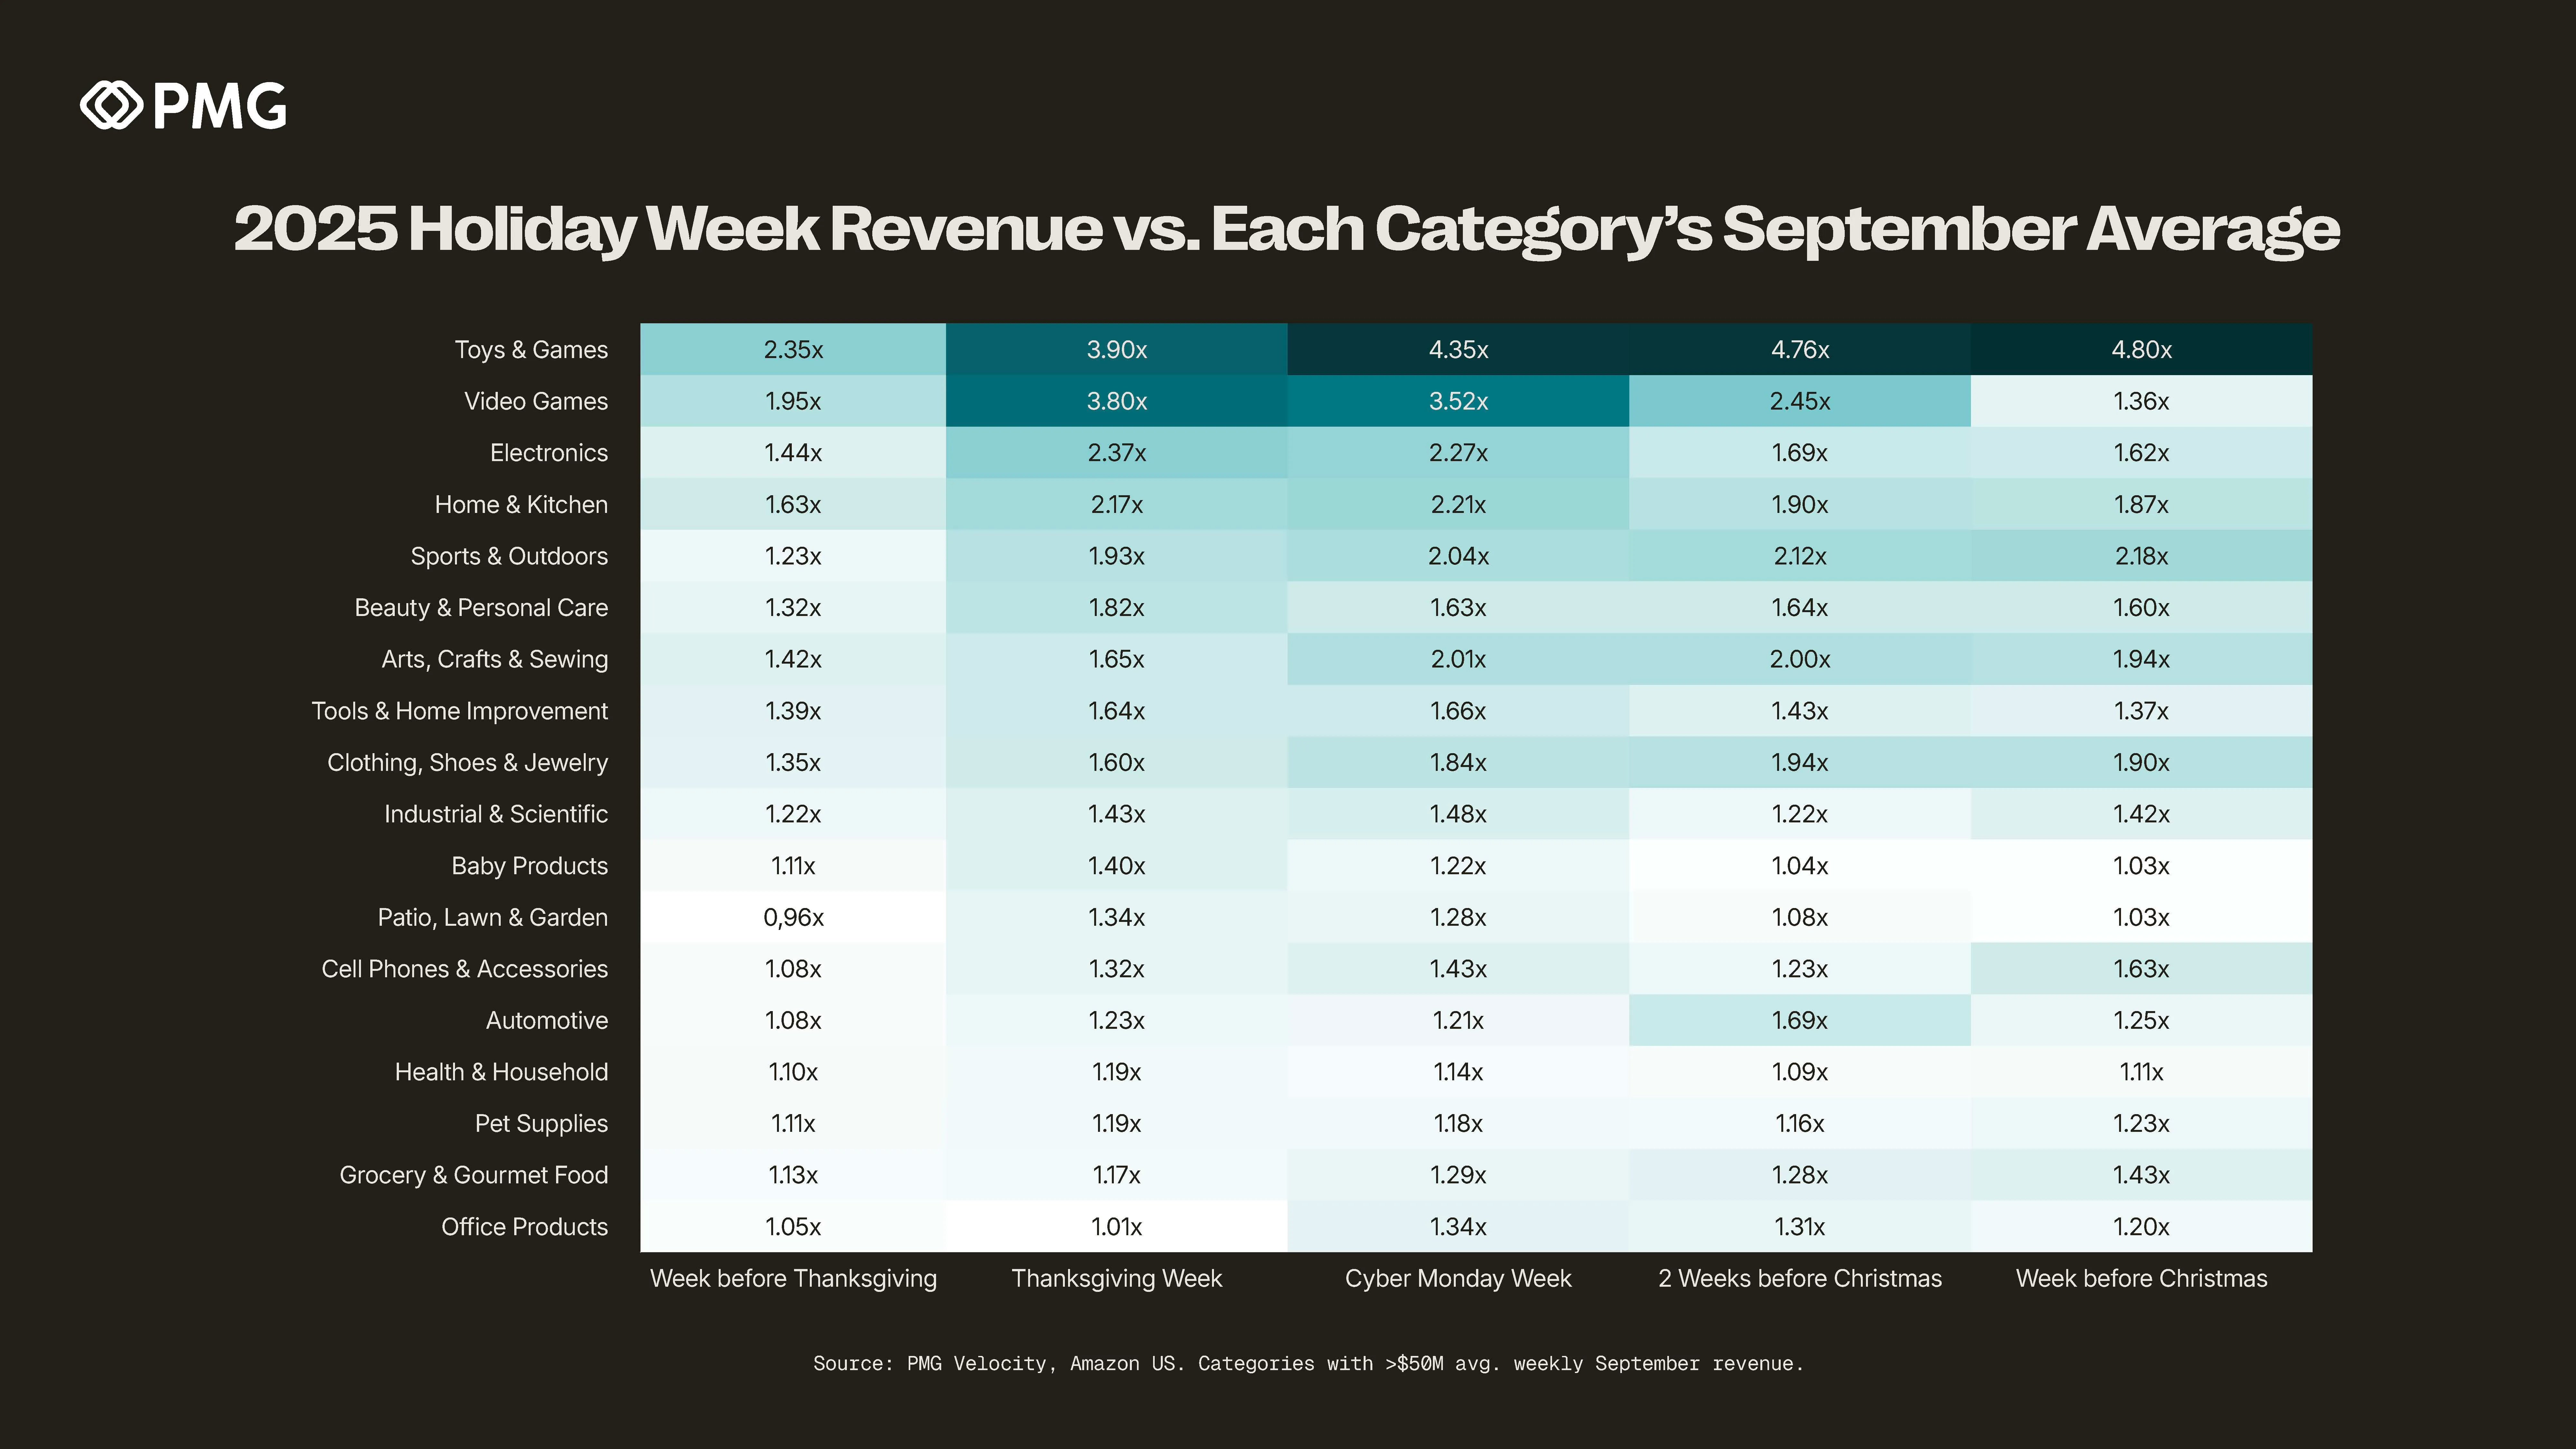
The shape of the peak period depends on the category, not the retail calendar alone. In 2025, Electronics peaked during Thanksgiving week at roughly 2.4 times its September baseline. Toys & Games kept building, from 3.9 times baseline during Thanksgiving week to 4.8 times in the week before Christmas. Apparel and Sports & Outdoors also sustained later-season demand. Electronics brands need to concentrate on delivering availability and promotional offers around that earlier peak, while those previously mentioned, later-peaking categories should prioritize preserving flexibility into December prior to shipping cutoffs.
Make Each Promotion Earn Its Place
A stronger season does not require discounting the entire catalog. PMG’s analysis shows that 45.6% of observed Amazon US products carried discounts during Prime Big Deal Days, down from 53.8% a year earlier, while average discount depth settled at 20.5%. Overall Amazon US revenue still grew 10.0%. This emphasizes that brands don’t need to discount every item they sell. Select offers based on product demand, margin, inventory and the role each item plays in the holiday plan is a better strategic framework.
The measure of success should be profitable additional demand, not participation alone. Brands with at least 75% of event revenue on discounted products grew about 16% in aggregate, while those below 25% declined about 11%. That association should act as a directional guidepost as brands investigate which offers worked, not a hard instruction to put three-quarters of your catalog revenue on deal. Category, product mix, and pre-existing demand can influence both discount participation and growth. Set product-level contribution targets and assess incremental sales where testing allows, rather than use revenue on discount as a target in itself.
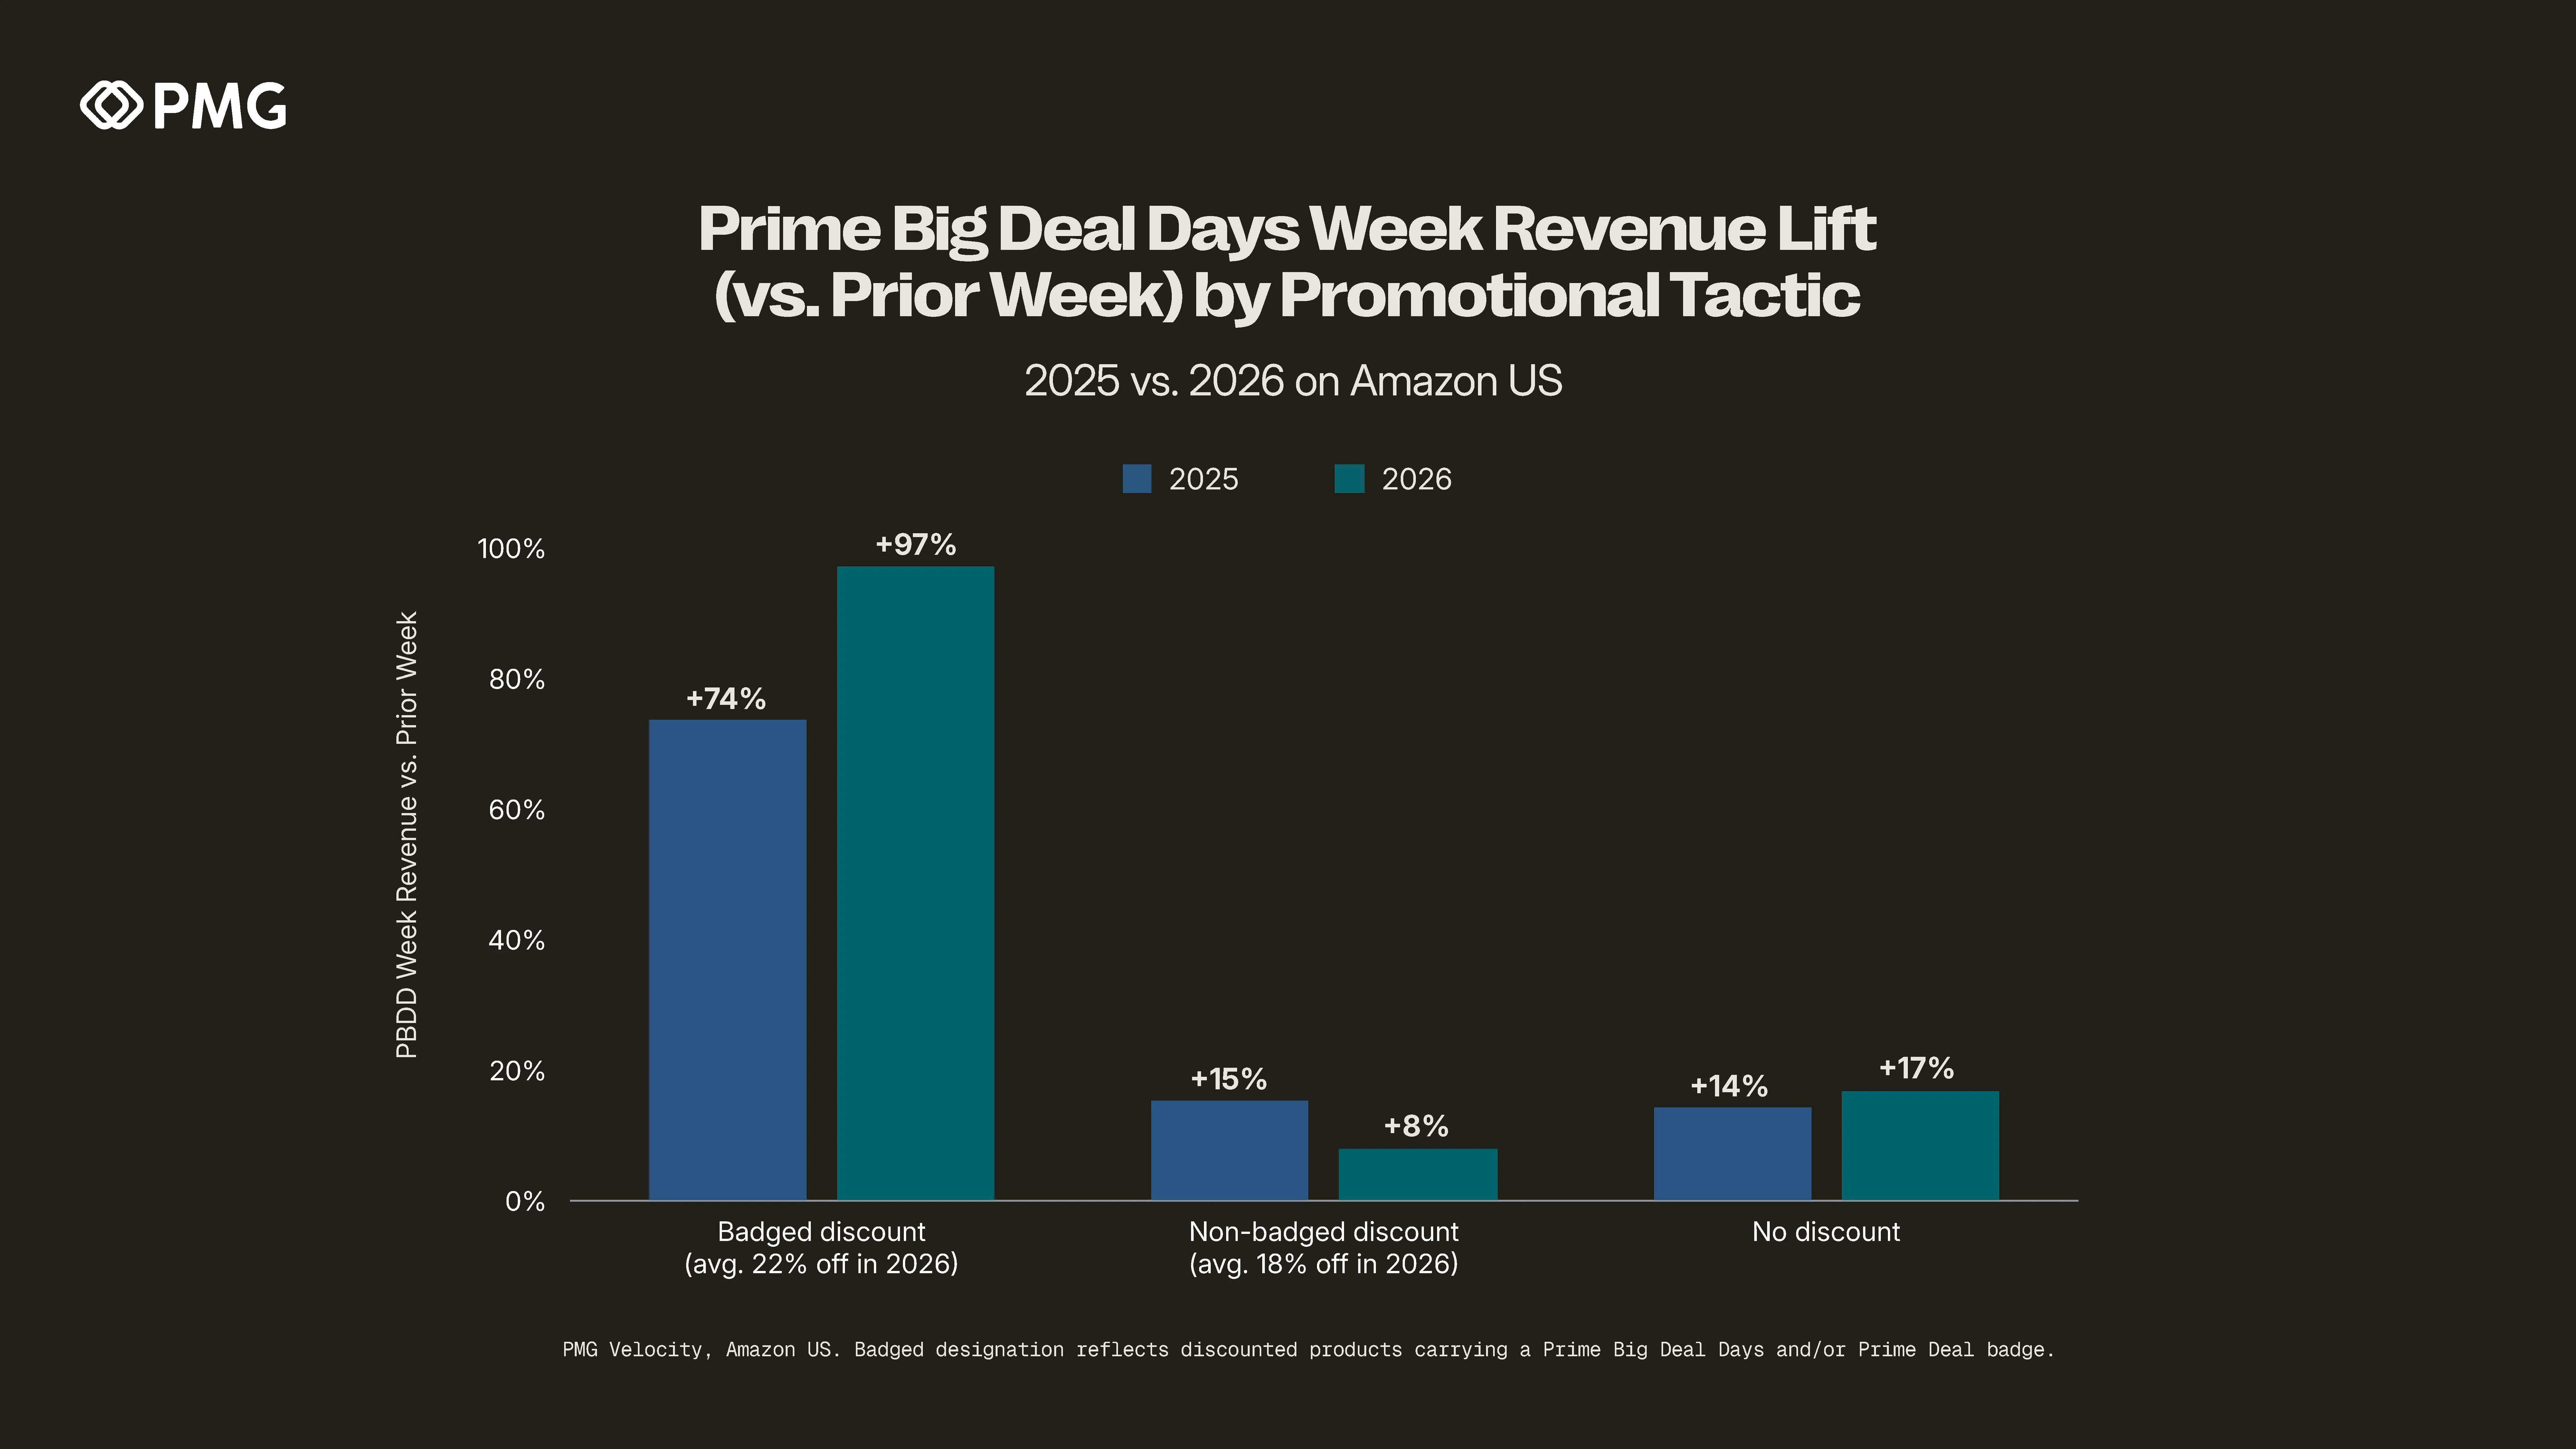
Deal visibility deserves scrutiny alongside price. Products with a Prime Big Deal Days badge recorded 97% week-over-week revenue growth, compared with 8% for non-badged discounted products and 17% for products without a discount.
Badged and non-badged products also had different average discounts, 21.5% and 17.7%, respectively. Note, these are different product cohorts, not a controlled test of a badge's effect.
Even so, the gap makes badge eligibility and how an offer appears to shoppers practical checks before committing promotional margin.
What Brand Leaders Should Decide Now
Translate the evidence of Prime Big Deal Days to inform one coordinated holiday plan: the products to promote, the weeks to support them, and the economics they must deliver. We recommend building your base forecast from category and recent marketplace demand; assign offers and inventory to each category's peak; and retain a December budget reserve where historical demand warrants it.
Review deal eligibility and presentation before offers go live, then reallocate using sales, stock and contribution results. Cyber Week should be the season's central activation, not the only period the business is equipped to win.
Methodology
Velocity estimates describe observed market performance, not causal promotional effects. PMG's proprietary commerce platform covers more than 30 million products on Amazon US. Revenue, unit and ASP comparisons use Sunday-Saturday event weeks. Cyber Week means the two full weeks containing Thanksgiving and Cyber Monday, not a five-day sales period. Holiday indices compare each year's weekly revenue with that year's September weekly average. The November-December concentration measure uses the eight-week comparison window from early November through Christmas week.
Comparisons have different coverage and should not be combined into a single denominator. Discount observations describe the products in the relevant promotional datasets. The brand-growth comparison is a selected matched cohort with more than $1 million in prior-year event revenue and discount data in both years, not all Amazon brands. Badge cohorts differ in composition and discount depth. Historical revenue timing does not establish that discounts ran for longer, nor does it measure media effectiveness. Prior-year figures reflect PMG's latest Velocity estimates and may differ from previously published results.
Appendix: Supporting Detail
Event performance provides context, not an incremental-sales estimate. PMG reports 2026 Prime Big Deal Days revenue growth of 10.0%, unit growth of 10.7% and ASP of $26.97, down 0.6%. ASP is revenue per estimated unit, not average order value. Event performance uses the full Sunday-Saturday week containing October 6-7, rather than the two event days alone.
The strongest timing evidence is historical and category-specific. Home & Kitchen peaked in Cyber Monday week at about 2.2 times its September baseline in 2025. Health & Household and Pet Supplies had much smaller holiday increases, around 1.1-1.2 times baseline. The category heatmap supplies the wider comparison without requiring a separate narrative for every category. These are planning reference points, not guaranteed 2026 outcomes.
Price and product mix need to be interpreted together. PMG found that products under $50 represented 61.9% of event revenue, unchanged from 2025. The $500-plus tier rose from 5.0% to 5.9%. Those shares do not track individual shoppers trading up or down; changes can also reflect which products and categories sold. Grocery's lower ASP supports a value-focused offer discussion, but does not by itself prove household-level switching.